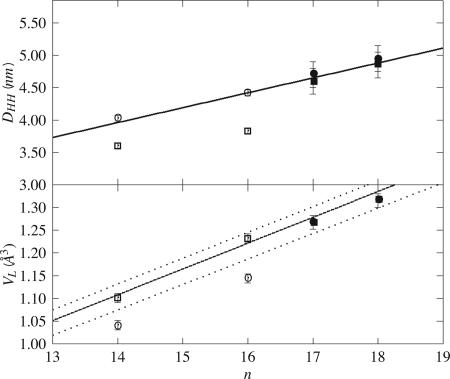
Fig. 6.
Structural data in the gel (filled circles) and fluid (filled squares) phases for di-Cn-PC n = 17 and 18 floating bilayer (grafted samples). Data for n = 14 and 16 (5) are plotted for comparison (open symbols). (Upper) Lipid head-to-head distance; the solid line is a linear fit, DHH = 0.74 + 0.23n nm. The variation of this parameter with temperature is not significant given the error bars. (Lower) Volume per lipid; the solid line is the prediction based on published values for the fluid phase (5) (the dashed lines indicate the uncertainty interval), VL = 312.7 + 56.8n nm3.

