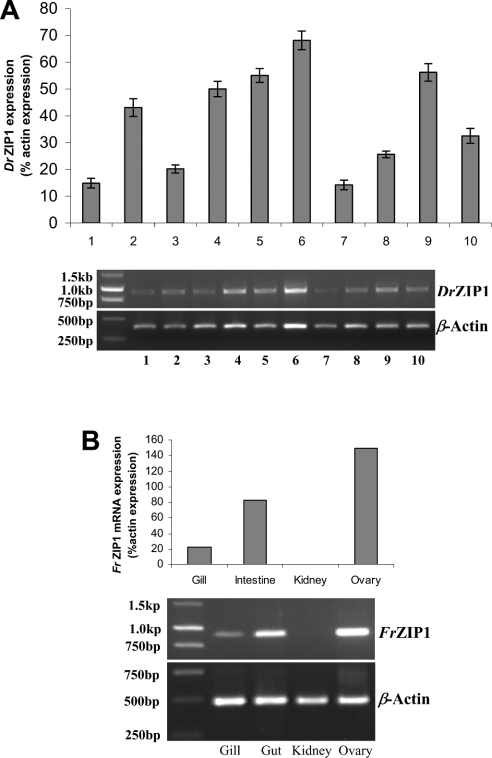
Figure 7. Tissue distribution of DrZIP1 and FrZIP1 mRNA in zebrafish and pufferfish.
(A) DrZIP1 mRNA levels, zebrafish gill (1), brain (2), intestine (3), kidney (4), eye (5), ovary (6), skin (7), fin (8), heart (9), and muscle (10) were determined by RT–PCR for 30 cycles. Upper panel: relative amount of DrZIP1 mRNA to β-actin mRNA in various tissues; and lower panel: expression pattern of DrZIP1 and β-actin mRNA in agarose gels. Values are means±S.E.M. (n=10), significant difference (P<0.05) between groups was tested with ANOVA followed by post-hoc test. (B) Levels of FrZIP1 mRNA in pufferfish gill, intestine, kidney and ovary were determined by RT–PCR for 30 cycles. Upper panel: relative amount of FrZIP1 mRNA to β-actin mRNA in various tissues; and lower panel: expression pattern of FrZIP1 and β-actin mRNA in agarose gels.

