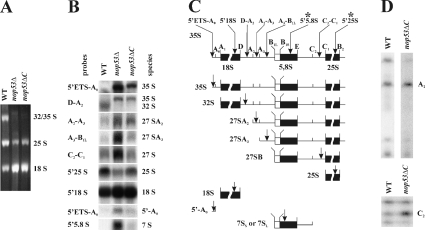
Figure 6. Northern hybridization and primer extension analysis reveal defects in rRNA processing in Δnop53 and nop53-ΔC strains.
(A) Total RNA isolated from WT and Δnop53 and nop53-ΔC cells was separated on a 1.4% formaldehyde/agarose gel and visualized by ethidium bromide staining. To normalize the 18 S signal between WT and nop53 strains, 2.5- and 2-fold more A260 units were loaded from Δnop53 and nop53-ΔC cells, respectively, relative to WT cells. Note that the intensities of the 25 S and 32 S bands are less in nop53 cells. (B) Northern-blot analysis of rRNA shows a specific defect in the 60 S subunit processing in nop53 strains. An identical gel to that shown in (A) was analysed by Northern blotting using oligonucleotide probes used to detect specific rRNA species. The probes are listed in the Experimental section. (C) The position of each probe and the rRNA species designed to detect are shown in the diagram of probe positions and pre-rRNA processing intermediates. Note the accumulation of the steady-state levels of the 35, 27 and 7 S species in nop53 cells and a decrease in 32 and 25 S levels indicating defects in 60 S processing. (D) Primer extension analyses were performed on the WT and nop53-ΔC strains. Analysis through ITS1 was performed using a 5′ to 5,8 S primer (marked with * in C), which hybridizes within mature 5.8 S rRNA, although analysis through ITS2 was performed using a 5′ 25 S primer (marked with * in C), that hybridizes within the mature 25 S rRNA. Note that the ITS1 and ITS2 regions of the 35 S rRNA transcript are not efficiently processed in nop53 cells as evidenced by the increased A2 and C2 signals.

