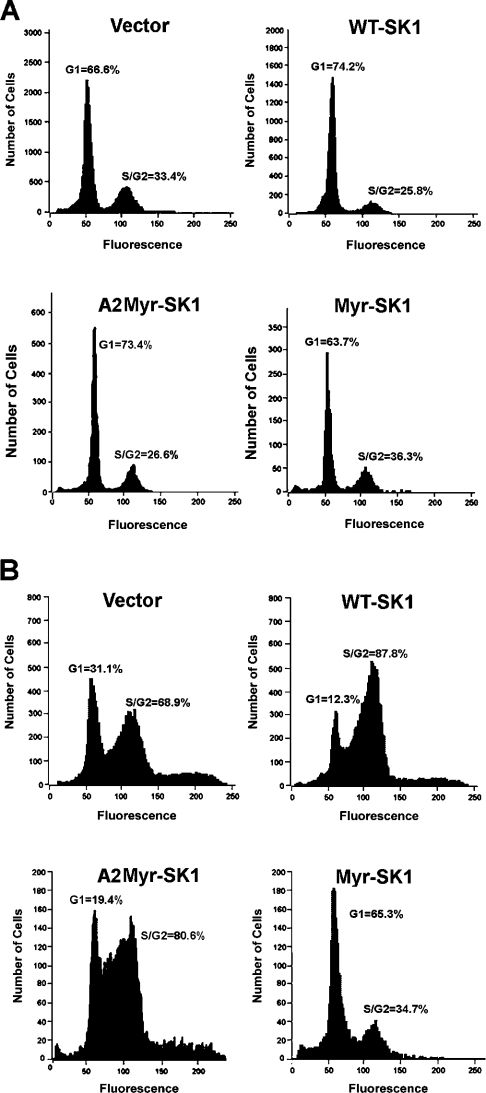
Figure 5. Analysis of cell-cycle distributions.
Cells were synchronized by serum deprivation (A) before being restimulated with 10% FBS (B). Cells were fixed in 70% ethanol and cellular DNA was stained with propidium iodide. Total DNA content was measured by FACS analysis. Results are representative of three independent experiments.

