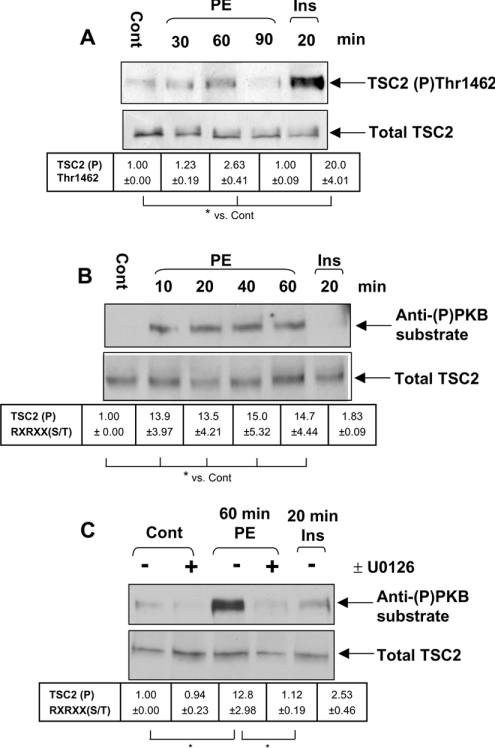
Figure 3. Treatment of ARVC with PE induces the phosphorylation of TSC2.
Isolated ARVC were cultured overnight and, where indicated, treated with 10 nM U0126 for 45 min before stimulation with either PE (10 μM) or insulin (10 nM) for the time periods indicated. Cells were pretreated with U0126 or with DMSO as a control. Cells were stimulated with 10 μM PE or 10 nM insulin for the time periods indicated and harvested as described above. Endogenous TSC2 was immunoprecipitated from 1 mg of lysate and analysed by SDS/PAGE and immunoblotting as described in Materials and methods section. Blots are representative of three independent replicate experiments using separate preparations of ARVC. (A) Immunoblot showing the level of TSC2 phosphorylated at Thr1462, assessed using a phospho-specific antibody. (B, C) Immunoblots showing levels of TSC2 phosphorylated at serine/threonine residues within RXRXX(S/T) motifs (using the so-called ‘anti-(P)PKB substrate antibody’). (A–C) Lower panels indicate total levels of TSC2 used to assess loading. Densitometry was conducted as described in the Materials and methods section. Phosphoblots were normalized to total protein levels before comparison. Values indicate fold change in the amount of TSC2 phosphorylated at the different sites relative to control (±S.E.M.). *P<0.05 as indicated.

