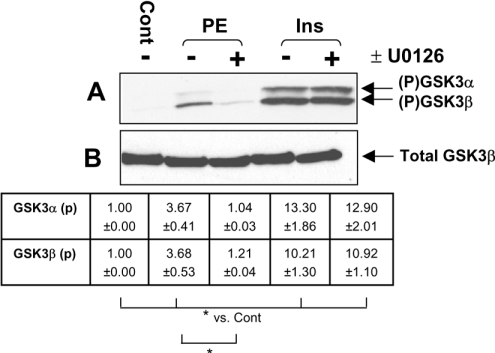
Figure 6. PE induces only limited phosphorylation of GSK3α/β in ARVC.
Immunoblot showing levels of GSK3α/β phosphorylation in samples stimulated with PE (10 μM) or insulin (10 nM) for 5 min. Extracts were separated by SDS/PAGE and subject to immunoblotting as described in the Materials and methods section. (A) Where indicated (+), isolated ARVC were treated with 10 nM U0126 for 45 min before stimulation. Cells were then treated with PE (10 μM) or insulin (10 nM). Phosphorylated GSK3α/β were detected with anti-phospho-(Ser21/Ser9) GSK3α/β. (B) An immunoblot probed for total GSK3β (the major isoform in ARVC) demonstrated equal loading. Densitometry was conducted as described in the Materials and methods section. Values represent fold change in phosphorylated GSK3α/β relative to control sample (±S.E.M.). Signals from phospho-blots were normalized to total protein levels before comparison. *P<0.05 as indicated. Blots are representative of three independent replicate experiments using separate preparations of ARVC.

