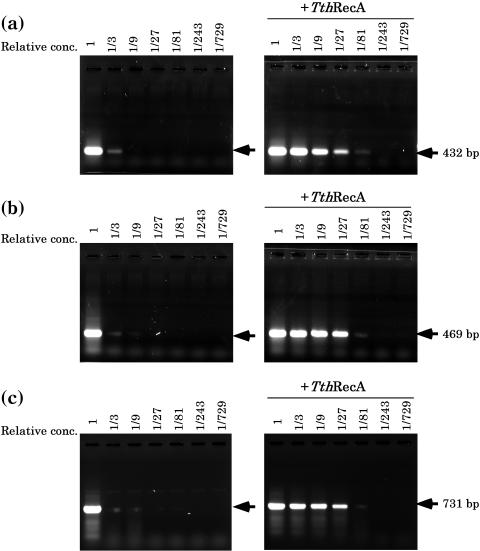
Figure 4.
The effect of primer concentration on PCR products. PCR was performed at different concentrations of primers at three human genomic DNA sites [(a) beta globin gene, (b) blue corn gene and (c) beta globin gene] in the absence or in the presence of TthRecA protein (and ATP). Throughout (a–c), PCR products at serially diluted primer concentrations (the original concentration: 0.2 μM each primer sets) are shown. Locations of the specific amplification products are indicted by arrows. The oligonucleotide sequences used for the primer sets are 5′-GGCAGCTTTCATGGGCACTG-3′ and 5′-GACAGGGCTGGACTGACATT-3′ for (a); 5′-CTGCTGAAAGAGATGCGGTG-3′ and 5′-AGGAAAACAGCCCAAGGGAC-3′ for (b); 5′-CTTTTTGTTCCCCCAGACAC-3′ and 5′-GCACTGGCTTAGGAGTTGGA-3′ for (c).

