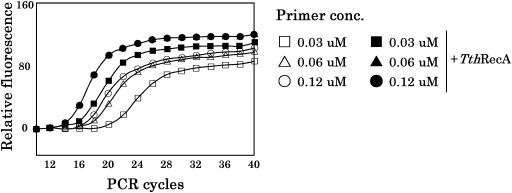
Figure 5.
Real-time PCR in the presence of TthRecA protein (and ATP). PCR was carried out in the absence and in the presence of TthRecA protein (and ATP) at different concentrations of primers. We employed three primer concentrations (0.03, 0.06 and 0.12 μM) and followed the appearance of PCR products (measured by the intensity of fluorescence) at each PCR cycle. In the figure, squares, triangles and circles represent primer concentrations of 0.03, 0.06 and 0.12 μM, respectively. Open symbols correspond to the control samples (without TthRecA protein and ATP) and closed symbols correspond to samples that contain TthRecA protein and ATP. The oligonucleotide sequences used for the primers are 5′-ACAATGGGCTCACTCACCCA-3′ and 5′-CTAAGACCAATGGATAGCTG-3′ (300 bp).

