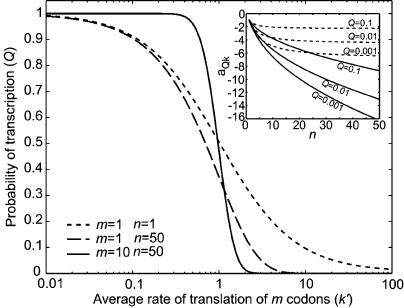
Figure 2. The Probability Q of Read-Through of the Attenuation Leader Is Plotted as a Function of k′ = 1/τ Where τ Is the Average Time for Translation of All the m Codons.
The translation rates of the individual codons are k = k′ · m. The average time to transcribe the n nucleotides is kept constant at 1/q′ = 1s. The transcription rate for an individual nucleotide is q = q′ · n. For m = 1, n = 1 the response function is given by Equation 6; for m = 1, n = 50 the response function is given by Equation 8. These curves should be compared to the much more sensitive response that is reached with two competing multi-step processes, as in attenuation (e.g., m = 10, n = 50). Insert: The sensitivity amplification aQk is plotted as a function of n, while k is kept fixed, and q is changed to get the read-through probabilities (Q) corresponding to the different curves. The two curve families correspond to the ordinary multi-step mechanism with m = 1 (dashed) and the competing multi-step mechanisms with m = n (solid), respectively. The dashed curves approach ln(Q) as n →∞, whereas the solid curves all go to −∞ for all values of Q.

