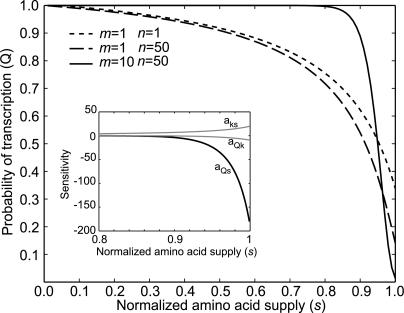
Figure 3. The Probability Q of Read-Through of the Leader Is Plotted as a Function of the Signal s .
For the curve with m = 10, k is given by Equation 9, and for the curves with m = 1, k is one-tenth of this value. q′ = 1s −1 for all curves. The usage frequency of the amino acid in proteins is f = 1/20, and the maximal rate of codon translation at full supply of amino acid is kmax= 20s −1. Insert: The contributions of the two factors to the sensitivity aQs= aQkaks is illustrated for the case with m = 10 and n = 50. aks approaches 1/f as s → 1. The asymptotic behavior of aQk is described in Figure 2.

