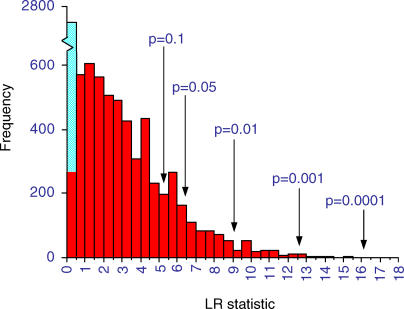
Figure 3. Distribution of 8,102 LRs for MIPS Pairs, Measuring the Strength of Support for the Phylogenetic Correlation.
Critical p-value cut-off points are derived from the random pairs data (see Results). The blue bar within the first class represents the 2,483 pairs for which one or both proteins were present in all 15 species (LR ≈ 0). The red bars record the remaining 5,619 LRs for pairs of proteins that both vary across species. Approximately 8% of the results exceed the p ≤ 0.05 level. Two pairs have LRs greater than 15.5 but are not visible on the graph. The excess of LR scores of 4–4.5 and 5.5–6 may arise from misidentified homology in S. kluyveri. This species is identified as having a smaller number of genes than its phylogenetic neighbours. These paired absences will tend to inflate correlations. We left these results in our analyses, as they affect the phylogenetic and across-species analyses equally, and we cannot be sure which absences are real and which are not.

