
Figure 1. The Correlations between Z, F, and P Scores.
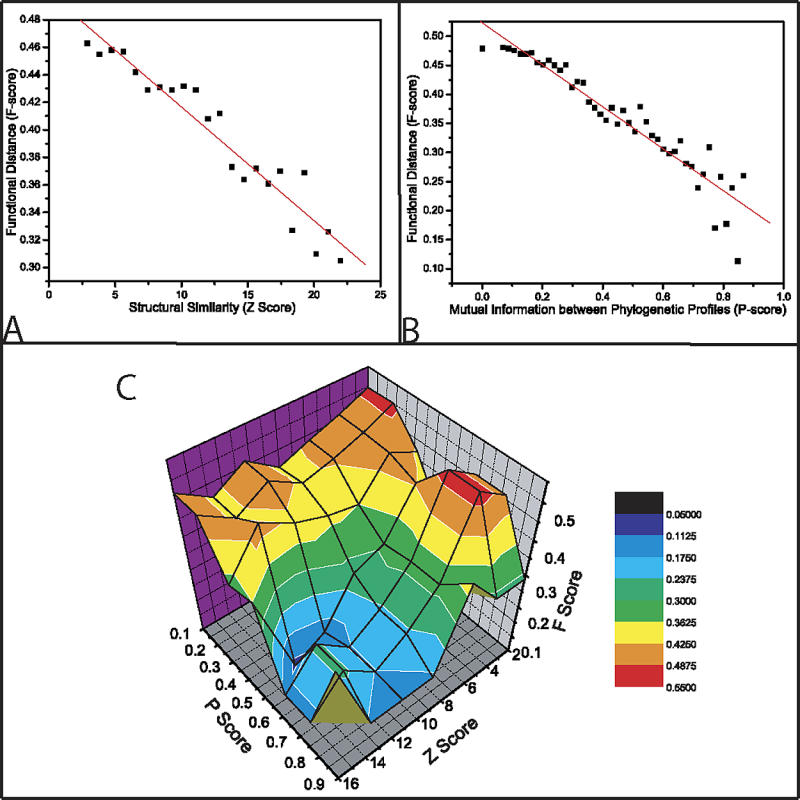
(A) The correlation between structural comparison Z-score and functional distance F-score. (Pearson's r = 0.96 and slope = 0.007.) Each bin contains at least 200 observations. It is worth noting that the average functional distance (F-score) falls from 0.48 to 0.30, only by a third during two decades of structural similarity [14].
(B) The correspondence between phylogenetic profile distances calculated using mutual information and F-score. Slope of the linear fit is 0.36, with Pearson's r = 0.96. The correlation is averaged, i.e., each data point represents a bin containing 150–200 domains, and the functional distances are averaged inside the bin [14].
(C) The landscape of functional distance with respect to Z and P scores. An average F-score is calculated for each of the 36 bins; each bin contains 100–200 observations. Since F-score is a distance metric, hotter colors represent domains that are farther away and cooler colors represent those that are closer.