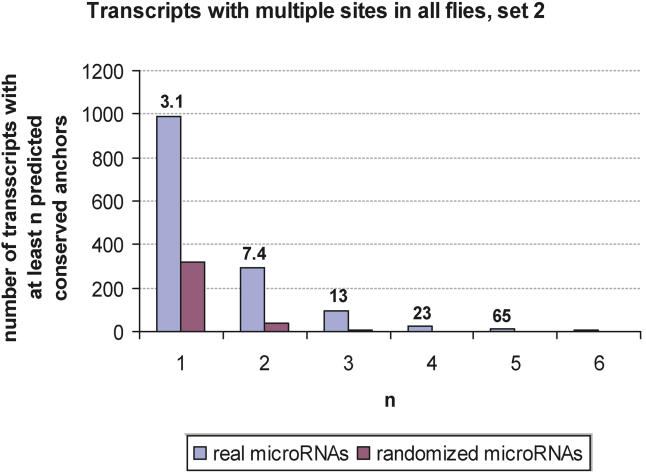
Figure 4. Specificity of PicTar Predictions of Genes with Multiple Putative Target Sites.
Number of unique genes as a function of the minimal number of anchor sites for 46 unique, conserved microRNAs and for randomized microRNAs (averaged over five cohorts). The ratio of these numbers, reflecting the specificity, is indicated above each bar.

