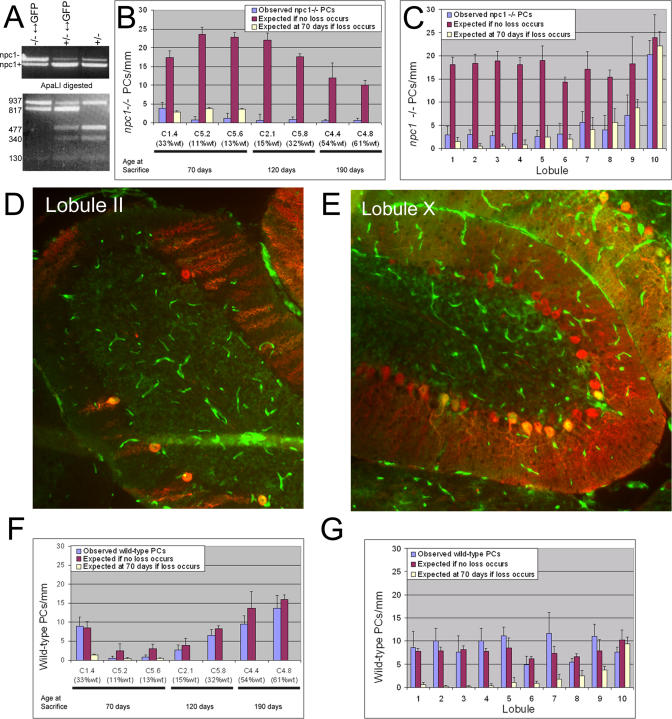
Figure 3. Cell-Autonomous Degeneration of PCs in Chimeric Mice.
(A) Genotyping of chimeric mice. Upper gel: PCR to amplify a fragment of the npc1 gene from npc1 −/−↔GFP, npc1 +/−↔GFP, and npc1 +/−mice results in npc1− (1,067 bp) and npc1+ (947 bp) bands. Lower gel: The three genotypes can be distinguished by ApaLI digestion of the PCR products. The npc1− allele gives rise to 937- and 130-bp bands. The wild-type allele varies depending on the source: the BALB/c allele is digested to 477-, 340-, and 130-bp bands while the allele from the GFP mouse is digested to 817- and 130-bp bands. Note that the 477- and 340-bp bands are absent from the homozygous mutant chimera.
(B) Quantification of npc1 −/− PC density in chimeric mice. For each mouse, the actual density observed (the average of the mean densities counted in each lobule) is compared to the number expected if no PC loss occurs (calculated from the density at 30 d in npc1 −/− mice and the chimerism percentage). Five sections separated by at least 100 μm were analyzed for each mouse. For the three mice sacrificed at 70 d, only lobules I–IX were included in the analysis because of the lack of degeneration in lobule X in npc1 −/− mice at this age. A value for the number of npc1 −/− PCs expected if loss does occur (calculated from the density at 70 d in npc1 −/− mice and the chimerism percentage) is also included for these three mice. No rescue of npc1 −/− PCs was observed for any of the chimeric mice (p < 0.0001 for each mouse comparing observed versus expected if no loss occurs).
(C) Quantification of npc1−/− PC density by lobule in C1.4 at 70 d. Observed and expected densities are shown for npc1 −/− PCs in each lobule. No clear rescue of npc1 −/− PCs was observed in any lobule (p > 0.05 for all lobules comparing observed versus expected if loss occurs, except II and III, where p-value is between 0.01 and 0.05; p < 0.001 for all lobules comparing observed versus expected if no loss occurs, except lobule X, where p > 0.05).
(D and E) Images of lobules II and X taken from C1.4 at 70 d. GFP is green and Calbindin staining is red. In lobule II, the number of PCs is clearly reduced and of the five remaining PCs, four are wild-type (GFP-positive). In lobule X (where no degeneration occurs during the normal npc1 −/− life span), PC density is normal and the majority of PCs (23 of 32; 72%) are mutant, as expected based on npc1 −/− contribution to this mouse (67%).
(F) Quantification of wild-type PC density in chimeric mice. Observed and expected densities are shown for wild-type PCs. For mice with more than 15% wild-type contribution, the density of wild-type PCs is similar to the number expected if these cells have not degenerated (p > 0.05 for each mouse comparing observed versus expected if no loss occurs, except C5.2, where p = 0.02, and C5.6, where p = 0.0005).
(G) Quantification of wild-type PC density by lobules in C1.4 at 70 d. No loss of wild-type PCs was observed in any of the lobules (p > 0.05 for all lobules comparing observed versus expected if no loss occurs; p < 0.001 for all lobules comparing observed versus expected if loss occurs, except for lobule X, where p > 0.05).

