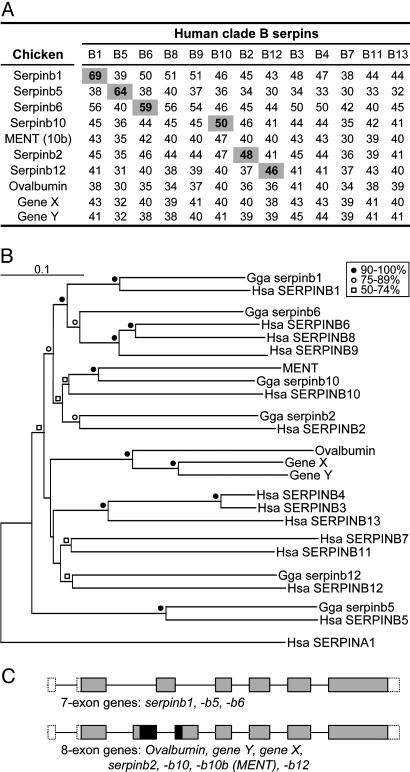
Fig. 3.
Comparative analyses of 10 chicken and 13 human clade B serpins. (A) Percentage of amino acid identity between chicken and human clade B serpins. Pairs with concordant highest-identity scores are highlighted. (B) Neighbor-joining tree of the chicken and human clade B serpins with human SERPINA1 (α1-antitrypsin) used as a root (348 sites compared). Code for bootstrap values is provided in the figure. (C) Gene structure of chicken clade B serpins. Boxes representing exons are drawn to scale with untranslated regions shown open, coding regions common to seven- and eight-exon genes shown shaded, and coding regions exclusive to the eight-exon genes shown black. Introns, which are shown as lines linking exons, are not drawn to scale. By using standard serpin numbering, based on α1-antitrypsin (7), the locations and phase of the introns are: 5′ untranslated region; amino acid (aa) 78, phase 0; aa 85, phase 0 (eight-exon genes only); aa 128, phase 0; aa 167, phase 1; aa 212, phase 0; and aa 262, phase 0.

