Fig. 3.
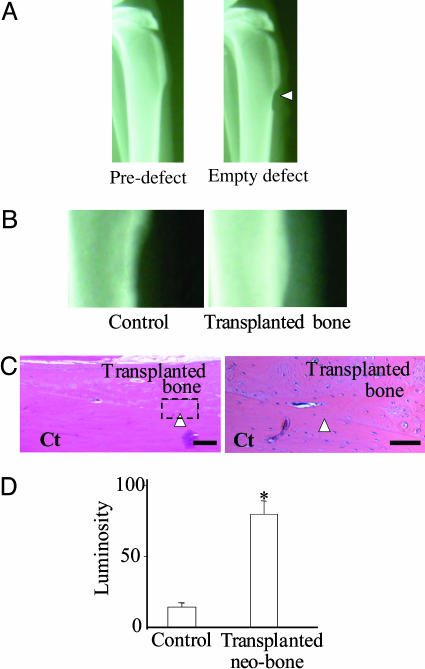
Autologous bone transplantation. (A) Radiography of typical rabbit tibia before and after creation of cortical bone defect. Arrowhead indicates empty defect. (B) Magnified radiographs of rabbit tibia defects 6 weeks after transplantation of Gelfoam (control) and autologous bone from the bone bioreactor in the contralateral tibia. (C) H&E-stained sections of the defect site 6 weeks after transplantation of autologous bone. Arrowhead points to the integration between transplanted bone and cortical bone of the tibia. Ct, cortical bone. [Bars, (Left) 200 μm; (Right) 50 μm.] (D) Radiographic densitometry evaluation of the tibial defects in grafted (n = 4) and control group rabbits (n = 4) after 6 weeks. (*, P < 0.1, ANOVA), presented as standardized luminosity where an empty defect has a value of 0, and cortical bone has a value of 100.

