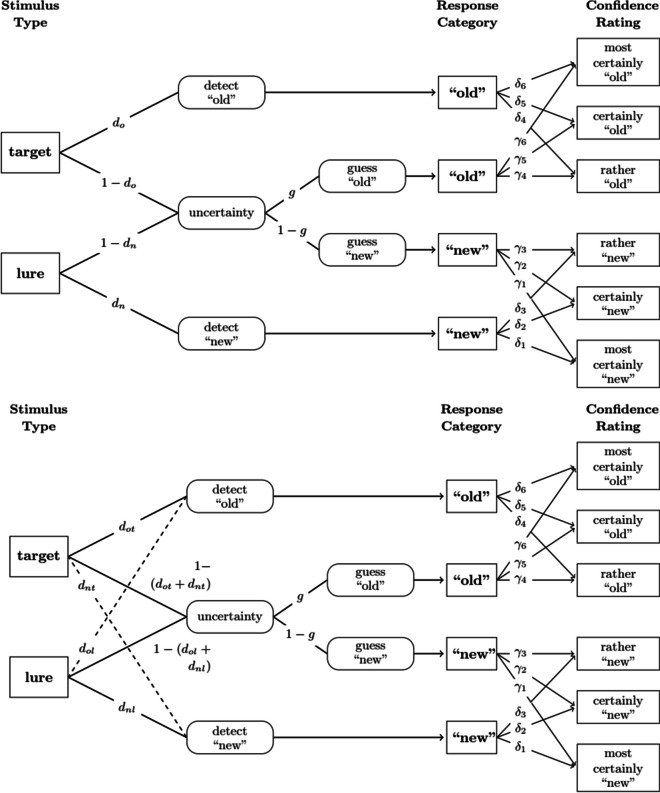
Fig. 1.
Depiction of the two-high threshold-model (upper panel) and the two-low threshold-model (lower panel) for a recognition task including confidence ratings. Note. The models represent the paths to certain response categories and confidence ratings for the two stimulus types (i.e., target and lure). Discrete latent states are depicted in rounded boxes with the conditional probability to enter each state denoted on the respective path. Dashed lines indicate the differences between the two-high and the two-low threshold-model

