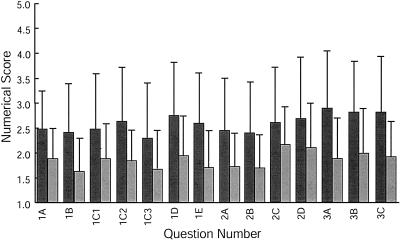
Figure 4.
Quantitative analysis of student response to vesicle transport and fusion exercise. Results from a Likert-style questionnaire are shown. The first bar for each question represents the response from students taught by an instructor who was leading the exercise for the first time. The second bar for each question represents the response from students taught by an instructor who had led the exercise previously. A score of 1 represents the best response, a score of 3 represents an average response, and a score of 5 represents the worst response.

