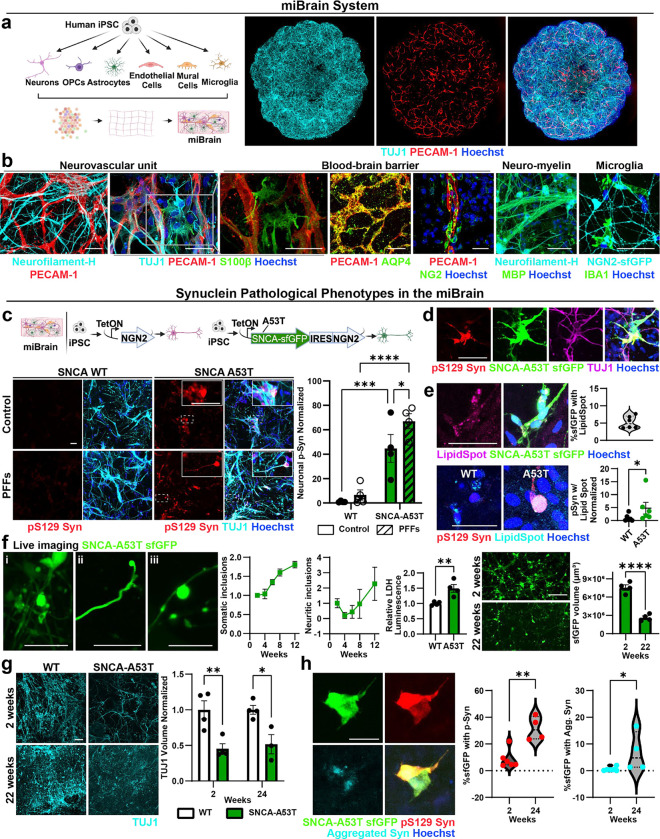
Figure 1. Induction of α-Syn intracellular inclusions in a multi-cellular integrated Brain (miBrain) tissue.
a. Cartoon and representative images of our multicellular integrated human brain (miBrain) tissue generated from human iPSCs differentiated into six brain cell types, including neurons, glia, and vascular cells. Four-week-old miBrains showing neurons (TUJ1, cyan) and vascular networks (PECAM-1, red). Scale bar: 500 μm. Nuclei: blue. b. miBrains stained for specific markers of neurons (cyan; Neurofilament-H, TUJ1, NGN2-sfGFP), astrocytes (green; S100b, AQP4), endothelial cells (red; PECAM-1), mural cells (green; NG2), myelin (green; MBP), and microglia (green; IBA1). Scale bar: 50 μm, nuclei: blue. c. miBrains containing neurons generated through direct iPSC reprograming via NGN2 expression, with or without the overexpression of SNCA-A53T. The tissue was cultured for a total of 18 days, with or without α-synuclein PFFs added on day 4. Immunofluorescence for neuronal marker TUJ1 and for α-Syn phosphorylated at Serine 129 (pS129) shows a robust expression of pS129-Syn in A53T neurons within the miBrains, but not in WT tissue. Scale bar: 50 μm, nuclei: blue. Neuronal pS129 expression was significantly increased in miBrains with A53T neurons. Exposure to PFFs exacerbated this effect. Bars represent means of pS129-Syn+ volume within TUJ1+ neurons normalized to control WT. Error bars represent standard error (n = 4 biological replicates). P-values were calculated using a 2-way ANOVA followed by a Fisher’s LSD test. d. SNCA-A53T was fused to small folding green fluorescent protein (sfGFP). pS129-Syn+ inclusions co-localize with sfGFP expression in TUJ1+ cells. Scale bar: 50 μm, nuclei: blue. e. Representative images depicting the co-localization of SNCA-A53T-sfGFP (green) and neutral lipid marker Lipid Spot (magenta) in A53T miBrains, or p-Syn (red) and Lipid Spot (cyan) in wild type and A53T miBrains cultured for two weeks. Arrowhead points to a lipid droplet within a p-Syn+ inclusion. The violin plot shows the percentage of sfGFP-SNCA volume occupied by the overlapping signal of Lipid Spot. The sfGFP-SNCA volume overlapped at 5.2 % ± 0.7 with lipid droplet marker Lipid Spot (mean ± standard error, n = 6 biological replicates). Dot plots represent the median overlapping volume between p-Syn and Lipid Spot normalized by nuclei (n = 5–6 biological replicates). P-values were calculated by Mann-Whitney test. Scale bar: 50 μm. f. Live imaging of SNCA-A53T-sfGFP in cell bodies (i), neurites (ii), and varicose-like inclusions (iii). Scale bars: 25 μm (i, ii) and 15 μm (iii). Line graphs show the number of somatic and neuritic inclusions normalized by the sfGFP volume over time (n = 4 biological replicates). Compared to WT, miBrains with A53T neurons had a significant increase in the levels of lactate dehydrogenase (LDH) in the media, indicating cell death. Bars represent mean LDH luminescence normalized to WT control, and error bars represent standard error (n = 4 biological replicates). P-values were calculated using an unpaired t-test. Representative images of live tracking of SNCA-A53T-sfGFP imaging and quantification at 2 and 22 weeks after miBrain assembly revealed a reduction in sfGFP area between 2 and 22 weeks (p < 0.0001). Bars represent mean sfGFP volume. Error bars represent standard error (n = 4 biological replicates). Scale bar: 100 μm. g. Representative images of miBrains with A53T or WT neurons. The volume occupied by neurons (cyan; TUJ1) was significantly reduced in miBrains with A53T neurons when compared with WT at 2 and 24 weeks. Bars represent TUJ1+ volume and error bars represent standard error (n = 3 biological replicates). P-values were calculated by 2-way ANOVA followed by a Tukey test. Scale bar: 50 μm. h. Representative images of A53T miBrains stained for pS129 α-synuclein (red) and aggregated α-synuclein (cyan) 24 weeks after assembly. Bars represent the percent volume of sfGFP-SNCA occupied by either pS129 α-Syn or aggregated α-synuclein staining. P-values were calculated by Mann-Whitney test. Scale bar: 25 μm. *P < 0.05, **P < 0.01, ***P < 0.001, ****P < 0.0001

