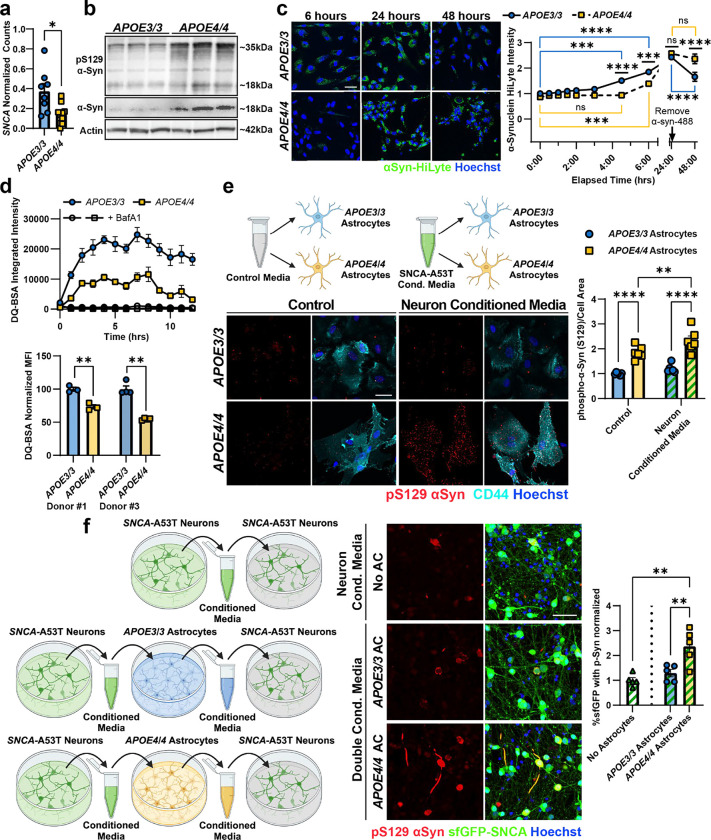
Figure 3. Impaired lysosomal function of APOE4/4 astrocytes seeds α-Syn phosphorylation in neurons.
a. Pseudobulk analysis of human astrocytes (Haney et al. 2024) for SNCA expression. Bars represent mean normalized psuedobulk gene count and error bars represent standard error (n = 8 APOE3/3 and n = 10 APOE4/4). P-value was calculated using unpaired t-test. b Western blots of APOE3/3 and APOE4/4 astrocytes for total α-Syn protein and phosphorylated α-Syn protein. Total and phosphorylated αSyn is increased in APOE4/4 astrocytes. The expected band size of α-Syn monomers is approximately 18kDa. β-Actin was used as a loading control. (n = 3 replicates). c. Representative images of uptake and degradation of exogenous, fluorescently labeled α-Syn (green). α-Syn was removed from the culture media after 24 hours. APOE3/3 astrocytes uptake and degrade αSyn more readily than APOE4/4 astrocytes. Data points represent mean values of α-Syn-HiLyte mean intensity normalized to nuclei area and APOE3/3 at the first time point. Error bars represent standard error (n = 4 replicates). P-values were calculated using 2-way ANOVA followed by a Tukey test. d. Left: DQ-BSA Red integrated intensity per cell confluency measured over 24 hours on an Incucyte (Sartorius). BafilomycinA1 at 100nM was used as a control for non-lysosomal proteolysis of DQ-BSA. Data points represent mean values and error bars represent standard error (n = 4 replicates). Right: DQ-BSA Green mean fluorescence intensity measured in DAPI negative cell population by flow cytometry after 24 hours in two different isogenic iPSC lines. Bars represent mean values normalized to APOE3/3 and error bars represent standard error (n = 3 replicates). P-values were calculated by unpaired t-tests. e. Representative images of pS129 α-Syn (red) in APOE3/3 and APOE4/4 astrocytes after exposure to fresh or conditioned neuron media. APOE4/4 astrocytes have more pS129 a-Syn, which is further increased upon incubation with neuronal media. Data points represent mean values of pS129 a-Syn normalized to cell area (CD44; cyan), and error bars represent standard error (n = 6 replicates). P-values were calculated using 2-way ANOVA followed by a Fisher’s LSD test. f. Left: schematic of the experimental paradigm generating “double conditioned media” from APOE/3 or APOE4/4 astrocytes previously exposed to neuronal media. Center, right: Representative images of SNCA-A53T neurons treated with neuron conditioned media or neuron and astrocyte conditioned media. Neurons treated with APOE4/4 double conditioned media showed significant increase in pS129 α-Syn compared to all other conditions. Bars represent mean pS129 volume normalized by sfGFP volume. Error bars represent standard error (n = 5 replicates). P-values were calculated using 1-way ANOVA followed by a Tukey test. All scale bars = 50 μm. *P < 0.05, **P < 0.01, ***P < 0.001, ****P < 0.0001.

