
Figure 3.
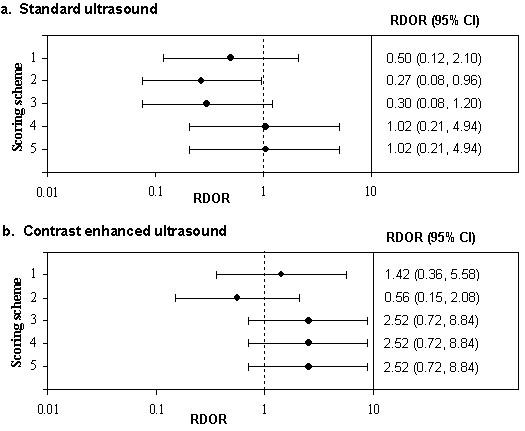
Forest plots showing the RDOR in "high" quality studies compared to "low" quality studies for each of the five quality scoring schemes
Official websites use .gov
A
.gov website belongs to an official
government organization in the United States.
Secure .gov websites use HTTPS
A lock (
) or https:// means you've safely
connected to the .gov website. Share sensitive
information only on official, secure websites.
Forest plots showing the RDOR in "high" quality studies compared to "low" quality studies for each of the five quality scoring schemes