
Figure 4.
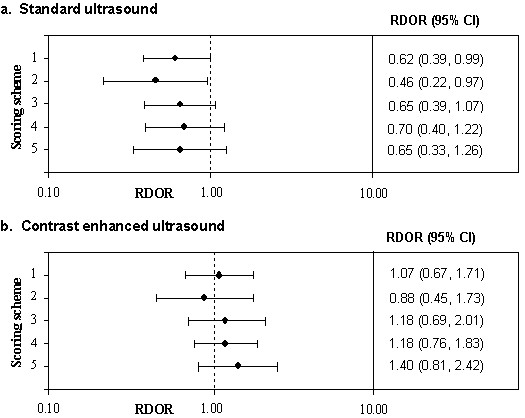
Forest plots showing the RDOR for a 10 point increase in quality for each of the 5 quality scoring schemes
Official websites use .gov
A
.gov website belongs to an official
government organization in the United States.
Secure .gov websites use HTTPS
A lock (
) or https:// means you've safely
connected to the .gov website. Share sensitive
information only on official, secure websites.
Forest plots showing the RDOR for a 10 point increase in quality for each of the 5 quality scoring schemes