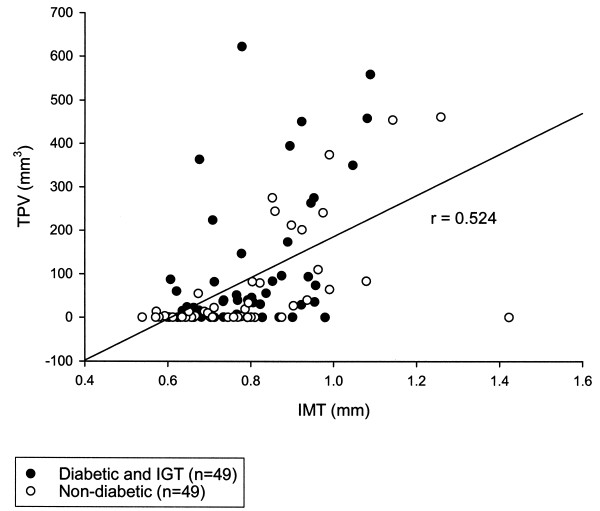
Figure 1.
Correlation between carotid arterial total plaque volume (TPV) and intima-media thickness (IMT). Subjects with type 2 diabetes or IGT are represented with black dots (n = 49), while non-diabetic control subjects are represented with white dots (n = 49). The Pearson correlation coefficient (r) = 0.524.

