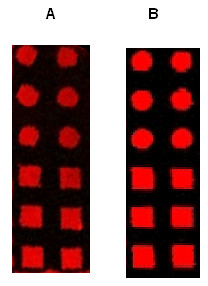
Figure 4.

Comparison between oligonucleotides and PCR fragments. Fluorescent images of typical micrometric printed features. Stamp was incubated for 30 sec with a 500 bp PCR fragment (dsDNA) of the yeast HSP12 gene (A) or with a 20-mer oligonucleotide of the same yeast gene (B), then set in contact manually for 15 sec with a dendrislide. Hybridisation was carried out with HSP12 complementary Cy5-labelled oligonucleotide. Values of fluorescence intensity were measured at 635 nm with the GenePix 4000B from axon at 600 PMT. Mean intensity at 635 of 12 features on two experiments – Background was 2120 for A and 4119 for B.
