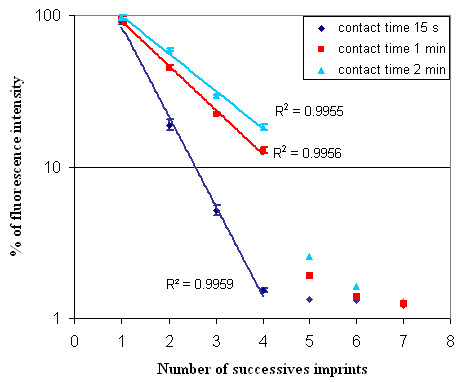
Figure 5.

Fluorescence signal variation for successive prints. Variation of the fluorescence intensity for successive prints and for three different contact times (15 seconds, 1 minute and 2 minutes) between the stamp and the slide. Stamp was incubated with a 35-mer 5'-labelled Cy5 oligonucleotide for 30 sec than put in contact with the dendrislides. The value of fluorescence intensity (fluorescent – background) was measured at 635 nm with Genepix scanner under 600 PMT optical excitation. Each point represents an average of 4 independent experiments. Fittings of the data points with an exponential linear regression (solid lines), exhibits good agreement as attested by the reported correlation factors R.
