

ABSTRACT
Understanding the drivers influencing ungulate population dynamics is crucial for developing conservation and management strategies to support wildlife health. Trace and macro elements are vital for ungulate growth, reproduction and survival. Thus, the trajectory of wildlife populations may be associated with element imbalances. Element concentrations can be measured in hair, an increasingly recognised bio‐monitoring tool. However, a better understanding of the relevance for wild ungulate population dynamics is needed. This study aimed to assess if element profiles in hair reflected the population trajectory of a keystone Arctic ungulate, muskox Ovibos moschatus, and whether benchmarks could be defined for element concentrations to assess population status. We measured qiviut (hair) element concentrations of 11 muskox populations ranging across northern America, including Greenland, and evaluated the association between element concentrations and different population trajectories. Seven trace and macro elements differentiated increasing populations from declining and stable populations using linear discriminant analysis. In general, copper, selenium, iron, manganese and cobalt tended to be at higher concentrations in increasing populations, whereas zinc and calcium were generally at lower concentrations in these populations, though variations were observed among populations. Benchmarks were defined for copper, selenium and iron, indicating populations were more likely to decline below a threshold concentration of these elements (‘limit’) and increase above a threshold concentration (‘target’). ‘Limit’ benchmarks were defined for zinc and calcium where populations were more likely to be increasing below this threshold value. Hair element profiles are a useful indicator of population trajectory in wild ungulate populations. Identified benchmarks can be used to assess population status, complementing ongoing but irregular and expensive monitoring efforts like population surveys, while trace element concentrations can provide insights into the mechanisms driving population change. Hair samples can easily be collected non‐invasively or alongside other monitoring activities, enhancing proactive wildlife management and conservation.
Keywords: hair minerals, non‐invasive bio‐monitoring, Ovibos moschatus , population trajectory, ungulate, wildlife nutrition
This study assesses the concentration of trace elements in muskox qiviut (hair) in populations with different trajectories. We found that certain elements, including copper, selenium and iron, were more likely to be higher in increasing populations and lower in declining populations and we defined thresholds for assessing the status of muskox populations.
1. Introduction
Ungulates are broadly recognised for their role in ecosystem structure and function (Bauer and Hoye 2014; Trouwborst 2019) and hold significant importance for people, especially those that rely on them for food and culture (Tomaselli et al. 2018; Pascual‐Rico et al. 2021). Understanding the drivers of ungulate populations is crucial for informing conservation and management strategies to ensure the persistence of healthy populations (Carpio et al. 2021; Desforges et al. 2021; Kauffman et al. 2021). The reproduction and survival of ungulates are closely linked to nutritional resource availability (Gaillard et al. 2000; Illius and O'Connor 2000). In addition to energy and protein, these resources also include nutrients, such as elements and vitamins, which are associated with health and fitness (O'Hara et al. 2001; Webster et al. 2021). Essential elements that are required for normal physiological functions, such as immunity, reproduction and growth, include trace elements that are required in small amounts (e.g., copper Cu and selenium Se) and macro elements that are required in larger amounts (e.g., calcium Ca and magnesium Mg; Nieder et al. 2018; Underwood 2012; Webster et al. 2021). Imbalances of these elements, either deficiencies or toxicities, can impact ungulates, such as being linked to reduced fertility, poor calf survival, impaired growth and increased adult mortality (Hidiroglou 1979; O'Hara et al. 2001; Soetan et al. 2010).
Deficiencies of trace and macro elements, particularly Cu and Se, have been linked to poor reproductive success and increased susceptibility to infectious diseases in wild ungulates (Flynn et al. 1977; Scaletti et al. 2003; Flueck et al. 2012; Afema et al. 2017; Durkalec et al. 2018). Conversely, elevated levels of elements, including heavy metals, can lead to toxicity, which can also impair immunity and reproduction and thus population productivity (Gamberg et al. 2016; Durkalec et al. 2018). Elements may also interact with each other; for example, molybdenum (Mo) can reduce the bioavailability of Cu (Puls 1994), and Cu deficiency has been linked to high levels of iron (Fe), calcium (Ca) and zinc (Zn; Herdt and Hoff 2011). While the importance of trace and macro elements for growth, reproduction and productivity in domestic livestock is well understood, our understanding of the role of these elements in wild ungulate populations is still limited (Blakley et al. 2000; French et al. 2017; Rioux et al. 2022).
Wild ungulates obtain elements through vegetation and water intake or through alternative sources with higher concentrations of elements, such as natural mineral licks (Klein and Thing 1989; Ayotte et al. 2006; Oster et al. 2018). The quality, abundance and access to elements vary temporally and spatially across heterogeneous geochemical landscapes, impacting the availability of important nutrients to ungulates (Oster et al. 2018; van Beest et al. 2023). This is especially important during periods that require additional resources, such as when females are pregnant or lactating (Tajchman et al. 2018). In areas with distinct growing seasons, ungulate reproduction is often synchronized with the peak of resource availability to exploit high‐quality forage (Couriot et al. 2023). Changes in climate are driving shifts in vegetation diversity, composition and phenology, which can change the availability and uptake of nutrients (Oster et al. 2018). However, few studies have addressed how the availability of elements in natural environments may impact individual or population‐level performance (but see van Beest et al. 2023). Understanding how the uptake of trace and macro elements available in the environment reflects population demographics would allow them to serve not only as a useful bioindicator but also to help us understand the links between the bioavailability of elements, ungulate nutrition and population trends.
The bioavailability of elements is likely to change with shifts in vegetation quality and availability due to climate change (Schmidt et al. 2002). These changes will be pronounced for Arctic ungulates, including caribou Rangifer spp. and muskoxen Ovibos moschatus because of the rapid rate of climate change in this region (Forchhammer et al. 2002; Mallory and Boyce 2018; Desforges et al. 2021). The energy and protein requirements for these species are generally well understood (Gustine et al. 2011; Barboza et al. 2018; Desforges et al. 2019). However, a better understanding of the dynamics of elements and their impact on ungulates is needed (Blakley et al. 2000; Flueck et al. 2012). Element concentrations have been associated with adult survival in caribou (Rioux et al. 2022) and moose Alces alces (O'Hara et al. 2001), and with calf recruitment in muskoxen (Mosbacher et al. 2022; van Beest et al. 2023). While measuring element concentrations in storage organs, such as the liver or kidney, is most common because these organs reflect the availability of elements in the body, hair is being increasingly used as a non‐invasive indicator of element concentration (Jutha et al. 2022). Elements are incorporated into hair during growth, which occurs during a defined period, after which it is separated from the body's metabolism; thus, element status in hair would represent element status in the body during hair growth (Combs 1987). Hair has been used for assessing individual health in woodland caribou R. t. caribou (Jutha et al. 2022), and as an indicator for a demographic measure, calf recruitment, in muskoxen (Mosbacher et al. 2022). These findings suggest that certain elements, Cu, Se and Mo, are linked to successful reproduction in muskoxen, which may have important consequences for population trajectories (Mosbacher et al. 2022). While these studies provide promising examples of using hair as an indicator of trace element status, it is important to validate this approach. Mineral status in the body may not always be accurately reflected in hair, and non‐dietary factors such as age and sex can also influence element levels (Combs 1987). However, such methods have the potential to be applied in contexts where traditional monitoring is challenging.
Muskox population monitoring is hindered by limited information due to sparse population surveys, which occur roughly every 10 years due to the significant costs of conducting aerial surveys in the Arctic (Cuyler et al. 2020). Therefore, other monitoring approaches, such as non‐invasive bio‐monitoring tools, are especially valuable. In this study, we focused on understanding the association between element concentrations (Cu, Se, cobalt Co, Zn, manganese Mn, Mg, sodium Na, Fe, Ca, Mo and chromium Cr) and muskox population trajectories based on population surveys. We first explored the association between trace elements measured in muskox qiviut, the dense undercoat hair that is shed annually and drivers of variation such as animal age class, qiviut growth year and sample collection type. Secondly, we examined the association between elements and population trends in 11 discrete muskox populations that were either decreasing, stable or increasing. The final goal was to provide criteria or ‘benchmarks’ to assess muskox population status based on the qiviut element profile.
2. Materials and Methods
2.1. Study Area and Sample Collection
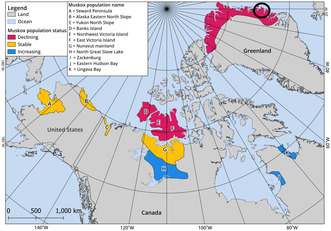
We collected qiviut samples from 11 muskox populations with contrasting population sizes and trends, across multiple years and from a large geographical range (Table 1; Figure 1). Of these, 4 populations were increasing, 4 were stable and 3 were declining at the time of qiviut growth as estimated by aerial surveys (Table 1). Muskoxen generally inhabit tundra, shrub tundra and shrubland, and forage in graminoid‐ and Salix‐dominated areas (Brodeur et al. 2023). Muskoxen have two types of hair: long continuously growing guard hairs and a dense undercoat called ‘qiviut’ which grows seasonally. Muskox qiviut grows during a discrete time period from spring to autumn (approximately a 6‐month period) and is shed in synchronised moults the following spring–summer (Flood et al. 1989). This means that qiviut can be used to track inter‐annual fluctuations of mineral levels in muskoxen. The qiviut growth period was defined as April to November in the year prior to collection (Di Francesco et al. 2022). In total, we collected 414 qiviut samples from different sex and age (calf, yearling and adult) classes spanning the qiviut growth years 2003–2018 (Table 1). Qiviut samples were collected outside the qiviut growth period using three collection methods. Freshly shed qiviut samples were collected from the ground from individual clumps during the summer months (n = 37, as described by Mosbacher et al. 2022). Shaved qiviut samples were collected from the rump of randomly selected tranquilised muskox during muskox captures for radio or GPS collaring (n = 143, as described Schmidt et al. 2016) and shaved qiviut samples were collected from the rump of hunted animals (n = 234, as described by Di Francesco et al. 2022). Animals were hunted by subsistence and sport hunters in the Canadian Arctic in collaboration with the local Hunters and Trappers organisations near the communities of Ulukhaktok in the Northwest Territories and Kugluktuk and Ekaluktutiak/Cambridge Bay in Nunavut. These are regular activities in the communities, and no animals were killed specifically for this study. Samples were obtained under animal care and wildlife research permits (Appendix S1).
TABLE 1.
Overview of populations included in this study ranging from Alaska to Greenland with the hair growth years when qiviut element concentration was measured, sample size and collection method. The population trends and sizes from aerial surveys (except Zackenberg which was estimated from ground surveys) relevant to the time of hair formation are reported, including the survey year, the annual change in population size (% change; percent of total population estimate or count), number of animals counted (count) and the estimated population size (estimate), including the 95% confidence intervals (95% CI). The hair growth year refers to the year of hair formation, rather than the year of collection.
| Population | Hair growth year(s) | N | Collection method | Population trend | Survey year | % change | Count | Estimate | 95% CI |
|---|---|---|---|---|---|---|---|---|---|
| Alaska | |||||||||
| Alaska Eastern North Slope a | 2006–2007 | 20 | Capture | Stable | 2015 | −1 | 198 | ||
| Seward Peninsula b | 2008, 2018 | 16 | Capture | Stable | 2017 | 1 | 2353 | 1908–2936 | |
| Yukon | |||||||||
| Yukon North Slope a | 2016–2018 | 20 | Capture (n = 14); Shed (n = 6) | Increasing | 2018 | 8 | 344 | ||
| Northwest Territories | |||||||||
| Banks Island c | 2017 | 9 | Shed | Declining | 2019 | −6 | 1877 | 10,979 | 9531–12,427 |
| Northwest Victoria Island d | 2016–2018 | 60 | Hunted | Declining | 2019 | −41 | 2444 | 5550 | 3878–7222 |
| North Great Slave e | 2017 | 22 | Shed | Increasing | 2018 | 11 | 1656 | 8098 | |
| Nunavut | |||||||||
| East Victoria Island (MX‐07) f | 2014–2018 | 61 | Hunted | Declining | 2013–2014 | −14 | 1296 | 10,026 | 8842–11,210 |
| Nunavut Mainland (MX‐09) g | 2013–2018 | 113 | Hunted | Stable | 2018 | −1 | 87 | 539 | 245–833 |
| Quebec | |||||||||
| Eastern Hudson Bay h | 2016 | 30 | Capture | Increasing | 2020 | 15 | 2500 | 1375–3325 | |
| Ungava Bay h | 2018 | 19 | Capture | Increasing | 2019 | 26 | 4500 | 3555–5715 | |
| Greenland | |||||||||
| Zackenberg i | 2013, 2015, 2017 | 44 | Capture | Declining | 2017 | 20 | 25 | ||
FIGURE 1.
The population or management units from which muskox qiviut samples were collected for this study. The population trend for each population at the time of sample collection is indicated by the colour. The areas were outlined by Cuyler et al. (2020). Samples from Greenland were collected within the black circle, and do not represent the entire range in North Greenland.
2.2. Qiviut Processing and Analyses
All samples were processed at the Alberta Centre for Toxicology, except for the samples from Eastern Hudson Bay, Yukon North Slope (captures) and Zackenberg, which were processed at the Observatoire Midi‐Pyrénées (OMP) using similar protocols and methods (for details see Appendix S1). For each sample, the qiviut was separated from the long, coarse guard hairs and visible contaminants, such as dirt, vegetation and dandruff, were removed with plastic tweezers. The qiviut samples (30 to 50 mg) were then individually washed twice in 95% ethanol and type 1 ultrapure water to remove remaining external contaminants and the lipid layer surrounding the hair, and then oven dried. A subsample of the dried qiviut sample was then digested with 2 mL concentrated nitric acid. The samples were further diluted with ultrapure water before analyses. The qiviut concentrations of 11 elements (Na, Mg, Ca, Cr, Mn, Fe Co, Cu, Zn, Se and Mo) were determined using inductively coupled plasma mass spectrometry (ICP‐MS; 8800 Triple Quadrupole ICP‐MS, Agilent). Each batch of samples included certified reference materials for quality control (NIST 2976 freeze‐dried mussel tissue and DORM‐3 fish protein), a blank sample as a negative control and a randomly selected duplicated qiviut sample. The acceptable criteria of the concentrations of elements measured in reference materials were within ±20% of the certified values, and blanks were negligible for all samples (Tables S1 and S2). Results below the limit of quantitation (LOQ) for certain elements were included in further analysis by assigning values as half the LOQ following Roug et al. (2015). If more than 50% of samples were below the LOQ for a specific element, that element would not be included in the analyses.
2.3. Statistical Analyses
All analyses were conducted using R software version 4.3.2 (R Core Team 2023). Six samples were excluded from the analysis due to missing information. Samples with outliers which were more than three times larger than the standard deviation were removed from the analyses (n = 6, Sullivan et al. 2021). Generalised linear mixed effects models were used to test the effect of collection method (harvest, capture and ground collection), animal age class (calf, yearling and adult) and sex (male and female) on the concentration of the 11 elements measured using the lme4 package (Bates et al. 2015). Population location and sampling year were included as a nested random effect. Age class and sex of individuals were not known for all populations (i.e., when samples were collected from the ground), and only samples with known age and sex were included in this analysis (n = 259). Model residuals were checked for normality using histograms of residuals and Q‐Q plots, and non‐normal variables were log‐transformed.
A multivariate analysis of variance (MANOVA) was used to assess which qiviut elements were associated with population trend (declining, stable or increasing). A Linear Discriminant Analysis (LDA) was conducted with the package mass (Venables and Ripley 2002) to assign these qiviut elements into specific dimensions defined by population trend, and model fit was assessed using the Wilks lambda criterion (Todorov 2007). To assess the model accuracy, leave‐one‐out cross‐validation was used to estimate prediction error, model accuracy, sensitivity and specificity. Cutoffs, which are referred to as benchmarks, were estimated as the midway point between the mean linear discriminant function for each population trend; the lower benchmark was defined between stable and declining populations, and the upper benchmark was defined between stable and increasing populations.
To provide criteria to assess muskox population status from qiviut element concentrations, an ordinal logistic regression was used with the significant elements. Elements were scaled by subtracting the mean and dividing by the standard deviation (Becker et al. 1988). Using predicted probabilities from the ordinal logistic regression, which are the probabilities at which one category becomes more likely than the adjacent category, benchmarks were defined. The lower value or ‘limit’ benchmark was defined as the element concentration below which the population has a higher probability of decline, and the higher value or ‘target’ benchmark was defined as the element concentration above which the population has a higher probability of increase, following benchmarks defined by Peacock et al. (2020).
3. Results
A total of 402 samples were included from 11 different muskox populations across multiple years, and all 11 elements were included in the analyses (Table S3). Some variation in hair element concentration was explained by the fixed effects in the models: collection method (Marginal R 2 (R 2m) for Na = 0.046; Mg = 0.066; Mn = 0.16; Fe = 0.059; Co = 0.17; Se = 0.28; Mo = 0.052), age (R 2m for Co = 0.018), sex (R 2m for Mo = 0.028), and age and sex (R 2m for Se = 0.032). However, most of the variation was accounted for by the random effect of population and sampling year. Variation explained for the full model including the random effect (R 2c) ranged from less than 4% for Zn (R 2c for collection type = 0.038; age and sex = 0.037) to more than 60% variance explained for Se (R 2c for collection type = 0.64; age and sex = 0.64; Tables S4 and S5).
3.1. Linking Element Status to Population Trends
Element concentrations differed according to population trend, and the MANOVA indicated that seven elements significantly explained population trend: Cu, Se, Co, Zn, Mn, Fe and Ca (F = 44.53, df = 14, p < 0.0001; Table 2). Linear discriminant analysis (LDA) indicated two linear discriminant functions explaining 100% of the variation in the data (Wilks' λ = 0.27, df = 12, p < 0.0001; Figure 2). The first linear discriminant differentiated increasing populations from stable and decreasing populations, explaining 79.5% of the variation. The second linear discriminant, while explaining 20.5% of the variation, differentiated stable from declining populations, and both overlapped with increasing populations. Cross‐validation showed that the LDA had a low error rate and high accuracy when predicting population trend (adjusted error rate = 0.27, sensitivity = 0.91, specificity = 0.76). The ‘target’ benchmark for the first linear discriminant was 1.24, and the ‘limit’ benchmark was −0.56 (Figure 3).
TABLE 2.
The difference in element concentration between muskox populations with different population trends. A MANOVA (F statistic) was used to determine which elements differed among population trends, and the mean concentration of each element (µg/g) with 95% confidence intervals (CI) is shown for each population trend.
| Element | df | F | p | Trend | Mean (µg/g) | 95% CI | |
|---|---|---|---|---|---|---|---|
| Lower | Upper | ||||||
| Sodium | 2 | 1.77 | 0.17 | Increasing | 57.97 | 41.49 | 74.45 |
| Stable | 47.24 | 35.27 | 59.21 | ||||
| Declining | 50.17 | 40.51 | 59.84 | ||||
| Magnesium | 2 | 3.29 | 0.038 | Increasing | 119.61 | 92.60 | 146.62 |
| Stable | 114.07 | 95.55 | 132.59 | ||||
| Declining | 112.79 | 98.75 | 126.83 | ||||
| Calcium | 2 | 27.21 | < 0.001 | Increasing | 356.68 | 325.88 | 387.47 |
| Stable | 470.78 | 449.33 | 492.24 | ||||
| Declining | 418.31 | 393.28 | 443.33 | ||||
| Chromium | 2 | 1.29 | 0.28 | Increasing | 0.53 | 0.36 | 0.70 |
| Stable | 0.24 | 0.03 | 0.45 | ||||
| Declining | 0.64 | 0.12 | 1.16 | ||||
| Manganese | 2 | 5.93 | 0.0029 | Increasing | 5.95 | 4.36 | 7.54 |
| Stable | 2.77 | 1.74 | 3.80 | ||||
| Declining | 1.65 | 1.11 | 2.18 | ||||
| Iron | 2 | 112.98 | < 0.001 | Increasing | 312.94 | 253.50 | 372.39 |
| Stable | 20.43 | 17.57 | 23.29 | ||||
| Declining | 46.79 | 32.11 | 61.46 | ||||
| Cobalt | 2 | 23.45 | < 0.001 | Increasing | 0.11 | 0.08 | 0.13 |
| Stable | 0.02 | 0.02 | 0.02 | ||||
| Declining | 0.02 | 0.01 | 0.03 | ||||
| Copper | 2 | 82.68 | < 0.001 | Increasing | 5.90 | 5.60 | 6.20 |
| Stable | 5.26 | 5.16 | 5.36 | ||||
| Declining | 4.51 | 4.38 | 4.63 | ||||
| Zinc | 2 | 9.33 | < 0.001 | Increasing | 92.50 | 86.24 | 98.77 |
| Stable | 104.20 | 102.40 | 105.99 | ||||
| Declining | 99.18 | 97.36 | 101.00 | ||||
| Selenium | 2 | 80.23 | < 0.001 | Increasing | 0.39 | 0.36 | 0.42 |
| Stable | 0.29 | 0.27 | 0.30 | ||||
| Declining | 0.19 | 0.18 | 0.21 | ||||
| Molybdenum | 2 | 0.063 | 0.94 | Increasing | 0.06 | 0.05 | 0.07 |
| Stable | 0.05 | 0.02 | 0.09 | ||||
| Declining | 0.06 | 0.05 | 0.07 | ||||
FIGURE 2.

The output of the linear discriminant analysis (LDA) shown as a biplot of the first linear discriminant (LD1) and the second linear discriminant (LD2). The arrows represent the direction and magnitude of coefficients for each element concentration measured in qiviut that was retained in the LDA.
FIGURE 3.

The median linear discriminant (LD1) value, interquartile range, range and outliers for each population trend for muskox populations. The blue line shows the upper benchmark for the first linear discriminant function and the red line shows the lower benchmark for the first linear discriminant function.
The discriminant function of the first linear discriminant was:
The discriminant function of the second linear discriminant was:
All elements were retained in the ordinal logistic regression except for Mn (χ 2 = 3.57, p = 0.059) and Co (χ 2 = 1.34, p = 0.25; Table 3). For Cu, Se and Fe, the probability of declining populations decreased with lower element concentrations, and the probability of increasing populations increased with higher element concentrations (Figure 4). The probability of stable populations was highest at middle values of these element concentrations, and the benchmarks were defined where the probability of either an increasing or declining population was higher than the probability of a stable population (Table 3). Mn and Co did explain population trends, but benchmarks could not be estimated (Figure 4). Conversely, for Zn, populations were most likely increasing at low element concentrations (Figure 5a). For Ca, the probability of stable populations was highest at low element concentration, and the probability of declining populations increased as Ca concentrations increased (Figure 5b). Only the ‘limit’ benchmark could be defined for Ca and Zn, where populations had a higher probability of decline with values above the benchmark. Cr, Mg, Mo and Na were not associated with population trends using the ordinal logistic regression analysis (Table 3; Figure 6).
TABLE 3.
The ordinal logistic regression (OLR) with the likelihood of the population trend changing with each element (odds ratio), including the 95% confidence interval (CI), and the ‘limit’ and ‘target’ benchmark (BM) for each element.
| Variable | OLR (t‐value) | Odds ratio | 95% CI | ‘Limit’ BM (μg/g) | ‘Target’ BM (μg/g) | |
|---|---|---|---|---|---|---|
| Copper | 9.35, p < 0.001 | 8.32 | 5.47 | 13.14 | 4.87 | 6.42 |
| Selenium | 7.82, p < 0.001 | 3.07 | 2.33 | 4.10 | 0.23 | 0.46 |
| Iron | 3.67, p < 0.001 | 2.09 | 1.53 | 2.98 | 24.66 | 230.50 |
| Zinc | −4.19, p < 0.001 | 0.41 | 0.27 | 0.60 | 94.06 | |
| Calcium | −2.66, p = 0.006 | 0.71 | 0.54 | 0.91 | 434.77 | |
| Manganese | 1.87, p = 0.06 | |||||
| Cobalt | −1.15, p = 0.25 | |||||
FIGURE 4.

The median concentration, interquartile range, range and outliers of qiviut elements for each population measured across different qiviut growth years, grouped by population trend, for the elements which were positively associated with population trend: (a) copper (Cu), (b) selenium (Se), (c) iron (Fe), (d) manganese (Mn) and (e) cobalt (Co). The blue line shows the ‘target’ benchmark for each element and the red line shows the ‘limit’ benchmark for each element, with a probability of 0.45.
FIGURE 5.

The median concentration, interquartile range, range and outliers of qiviut elements for each population measured across different qiviut growth years, grouped by population trend, for the elements which were negatively associated with population trend; (a) zinc (Zn) and (b) calcium (Ca). The red line shows the ‘limit’ benchmark above which each element has a 0.45 probability of decline.
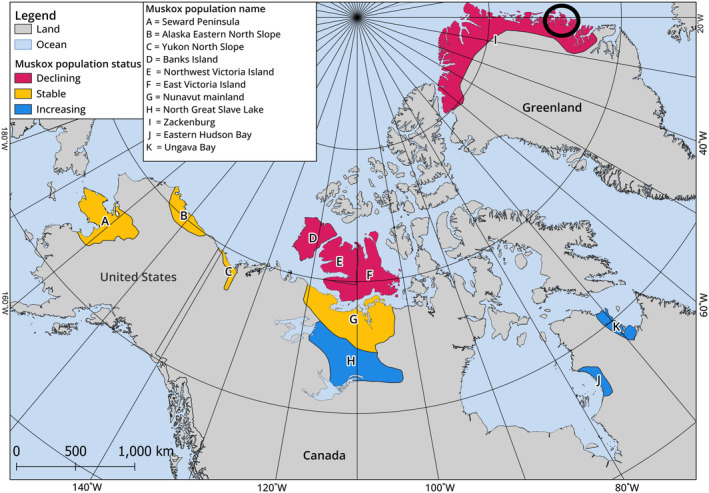
FIGURE 6.
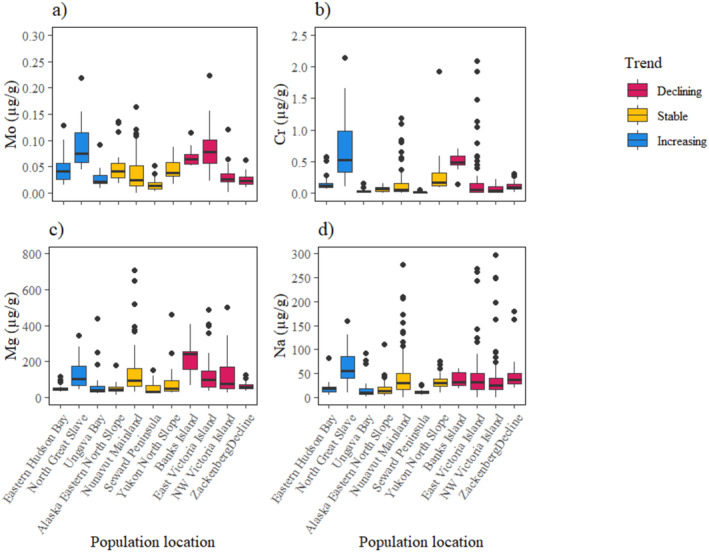
The median concentration, interquartile range, range and outliers of qiviut elements for each population measured across different qiviut growth years, grouped by population trend, for the elements which were not associated with population trend: (a) molybdenum (Mo), (b) chromium (Cr), (c) magnesium (Mg) and (d) sodium (Na).
4. Discussion
Element concentrations in hair have been used as a bio‐monitoring tool in a range of species, for example, antelope Taurotragus derbianus derbianus in Africa (Stoklasová et al. 2020), moose and caribou in North America (O'Hara et al. 2001; Jutha et al. 2022), and roe deer Capreolus capreolus , red deer Cervus elaphus and wild boar Sus scrofa in Europe (Montillo et al. 2019; Oropesa et al. 2022; Herrada et al. 2024), and have significant implications for ungulate conservation (Flueck et al. 2012). We evaluated qiviut trace and macro element status across 11 populations of muskoxen across the North American Arctic and found high variability in the concentration of elements in qiviut among populations. The concentration of six trace elements, Cu, Se, Fe, Mn, Co and Zn, and one macro element, Ca, was associated with population trend. We established ‘limit’ and ‘target’ benchmarks for three of these elements, Cu, Se and Fe, and ‘limit’ benchmarks for an additional two elements, Zn and Ca, which can inform population trajectory. The data presented here can be directly used as a management tool for assessing the status of muskoxen populations, and these methods can be used to support the management of other wild ungulate species.
Trace elements tended to be more similar among declining and stable populations compared to increasing populations, which were generally associated with higher concentrations of Cu, Se and Fe. Although studies most often evaluate the role of element deficiencies (Hidiroglou 1979; Flynn et al. 1977; Grace and Wilson 2002; Flueck et al. 2012), adequate concentrations of these elements have been associated with higher reproductive rates, including pregnancy (e.g., moose; Newby and DeCesare 2020), juvenile recruitment (e.g., black‐tailed deer Odocoileus hemionus columbianus ; Flueck 1994) and juvenile growth (e.g., red deer; Handeland et al. 2008). Our findings suggest that these elements may be more likely to facilitate population growth than to contribute to population decline. This is likely due to the effects of adequate element concentrations on reproductive success and capacity, which influence ungulate population growth (DeCesare et al. 2012). In muskoxen, Cu is particularly important for juvenile recruitment because foetuses require adequate Cu during late gestation (Rombach et al. 2003), which may be limited by maternal diet during late winter (Schmidt et al. 2023).
Mn and Co tended to have a positive association with population trend, while Zn and Ca generally were negatively associated with population trend. However, the association between these elements and population trends was small. Mn is generally maintained at stable blood concentrations unless it is deficient or below a threshold, and Co is often found at low concentrations in hair samples, which may explain why only a small effect was detected (Puls 1994; Aschner and Aschner 2005; Ceacero et al. 2009; Jutha et al. 2022). Observed deficiencies in these elements may not be directly linked to population declines. However, adequate concentrations of these elements, in conjunction with others, are likely to support successful reproduction and consequently population growth. Conversely, lower concentrations of Zn and Ca were observed in increasing populations. This may reflect the increased use of these elements resulting in lower element concentrations in the plasma and thus reduced deposition in hair (Sharma et al. 2007). Additionally, different levels of Ca intake, depending on the bioavailability of these elements in the environment, can impact observed element concentration (Littledike and Goff 1987). Interactions with other elements may also occur; for example, elevated concentrations of Zn and Ca may be linked to Cu deficiency because these elements may limit the absorption of Cu (Osredkar and Sustar 2011; Herdt and Hoff 2011), and Ca may increase when phosphorus is low in forage (Littledike and Goff 1987). In fact, a common trace element imbalance in humans is elevated Cu and low Zn, and their ratio is clinically important (Osredkar and Sustar 2011). Our understanding of element interactions in biological systems is still limited, and inferences can often be drawn from the human health literature (García‐Barrera et al. 2012).
Animal nutrition is complex, and the extent to which other elements are present can influence interactions (Soetan et al. 2010). Adequate nutritional intake of all essential elements is most likely to facilitate healthy wildlife populations and successful reproduction (National Research Council 2007; Soetan et al. 2010). Additionally, synergistic or antagonistic interactions occur at deficient and excess concentrations of elements; thus, elements cannot be considered in isolation (García‐Barrera et al. 2012). In the present study, elements that contributed to the discriminatory analysis, ordered by their discriminant function coefficient, were Cu, Se, Fe, Mn, Co, Zn and Ca. While these elements together explained some of the variation in population trend, only three, Cu, Se and Fe, could be used to define ‘limit’ and ‘target’ benchmarks. Dietary intake has been associated with hair concentrations of Cu, Se, Mo and Co (Combs et al. 1982; Cunningham and Hogan 1958; Ghorbani et al. 2015; Kellaway et al. 1978). In contrast, the status of elements such as Fe and Zn may not be well represented by hair (Combs et al. 1982; Roug et al. 2015). While the benchmark values are useful for assessing population status, the overall hair element profile should be referred to for a broader understanding of nutritional status.
The concentrations of Cr, Na, Mg and Mo did not reflect muskox population trends in this study, suggesting that the nutritional significance of these elements was not adequately reflected in hair samples. The mechanisms through which elements are metabolised in the body, deposited in growing hair and their interactions may complicate how these concentrations are measured. This is due to metabolic interactions and fluctuations in serum and organ levels, as well as bioavailability (Combs 1987). Thus, hair element concentrations and their relevance to individual or population health may be more complicated and not adequately reflected in this tissue. Mo is regularly included in studies assessing the role of elements on ungulate populations, but Cr, Na and Mg are not frequently considered (Webster et al. 2021; Jutha et al. 2022; Mosbacher et al. 2022; van Beest et al. 2023) except see Forchhammer and Boomsma (1995) for the uptake of Na during winter foraging strategies in muskoxen. These elements are relevant for ungulate health, including growth, reproduction and survival, but have not yet been associated with population‐level effects (Ropstad et al. 1997; Staaland and White 2001; Rioux et al. 2022). Although Rioux et al. (2022) suggested that adult caribou survival is linked to higher concentrations of Na, the reported confidence interval includes zero, which leaves uncertainty about the presence of an effect.
We found high variation in qiviut trace element profiles within and between muskox populations. Confounding factors such as landscape geochemistry, season, nutrition, animal age, and body position of hair may influence hair trace element concentrations (Combs 1987; Roug et al. 2015; Di Francesco et al. 2022). While there were some significant effects of age, sex and collection type, most of the variation was accounted for by interpopulation and interannual differences. This variation may be driven by environmental changes, such as latitudinal variation in the bioavailability of elements, or annual changes in environmental drivers of bioavailability, such as weather patterns. The large geographical scale of this study means that habitat, and consequently bioavailability, is likely to vary among regions. Exploring the drivers of this variation, understanding region or habitat‐specific differences and how this may impact muskox populations is an important avenue of research. Despite this potential for confounding factors, we were able to show the associations between qiviut element status and population trends across a large geographical scale. A small effect of collection type was identified for Mn and Co, where element concentration in ground collected samples was higher, and Se, where element concentration was lower in harvest samples. Appropriate care must be taken when collecting samples using different methods and when interpreting results (Rakic et al. 2023). Although we did not find consistent differences in element concentrations depending on collection method, we recommend sample collection be conducted consistently to reduce potential variation. Ultimately, more detailed knowledge about element levels, particularly in hair, and how these are correlated with field and clinical observations including the biochemical status of vegetation (Oster et al. 2018; van Beest et al. 2023), will improve inferences that can be made about trace element concentrations in ungulates.
In this study, we showed that hair concentrations of certain elements may reflect different population trends in muskoxen, and we have identified threshold values for elements associated with increasing, stable and declining populations. These findings were also supported by Mosbacher et al. (2022) which found similar thresholds for Cu and Se in qiviut samples collected from the ground. Identifying threshold values that can provide insights into the status of wildlife populations can be an invaluable and actionable tool for wildlife managers (Peacock et al. 2020; White et al. 2014). Benchmarks can be used to define whether a population is healthy and resilient (‘target’) or at risk of extirpation due to decline (‘limit’; Peacock et al. 2022). Establishing these benchmarks requires defining how changes in metrics, which are sensitive and specific to population health, correspond to changes in population health (Rice and Rochet 2005). This can be accomplished by collecting information over an appropriate temporal and spatial range using standardised approaches (Kutz et al. 2013). By incorporating this non‐invasive bio‐monitoring tool into muskox population management on an annual basis alongside population surveys, a comprehensive longitudinal database can be established to track changes in population trajectory and hair element status. Region‐specific differences may also be important for population health; thus, longitudinal data can provide information on the specificity of benchmarks to regions. While Cu, Se and Fe were the most useful elements for defining benchmarks, it is important to recognise the broader element profile reflected in hair, including Co, Zn, Mn and Ca, which collectively play a role in ungulate health and reproduction. When using these benchmarks, it should be noted that in this study we found that higher concentrations of elements were generally beneficial for muskox populations; however, toxicity can occur when trace element concentrations are in excess (Gamberg et al. 2016; Durkalec et al. 2018). Incorporating routine screening for element concentrations, as demonstrated in this study with muskoxen, can support wildlife population monitoring and management practices. Qiviut and hair from other ungulates are easy to collect passively from the environment or through anyone with access to animals through harvesting or monitoring practices and can be simply stored at room temperature (Combs 1987; Jutha et al. 2022). Using benchmarks from individual elements or trace and macro element profiles measured from hair can provide a timely and effective tool to assess population status, thereby supporting proactive wildlife management and conservation.
Author Contributions
Eleanor R. Dickinson: data curation (equal), formal analysis (lead), visualization (lead), writing – original draft (lead), writing – review and editing (lead). Jesper Bruun Mosbacher: conceptualization (equal), data curation (lead), methodology (equal), visualization (equal), writing – review and editing (equal). Colleen Arnison: data curation (equal), methodology (equal), resources (equal), writing – review and editing (equal). Kimberlee Beckmen: data curation (equal), methodology (equal), writing – review and editing (equal). Steeve D. Côté: conceptualization (equal), data curation (equal), methodology (equal), writing – original draft (equal), writing – review and editing (equal). Juliette Di Francesco: data curation (equal), methodology (equal), writing – review and editing (equal). Sophia V. Hansson: data curation (equal), methodology (equal), resources (equal), writing – review and editing (equal). Elham Z. Jahromi: data curation (equal), methodology (equal), resources (equal), writing – review and editing (equal). David W. Kinniburgh: data curation (equal), methodology (equal), resources (equal), writing – review and editing (equal). Gäel Le Roux: data curation (equal), resources (equal), writing – review and editing (equal). Lisa‐Marie Leclerc: data curation (equal), methodology (equal), writing – review and editing (equal). Fabien Mavrot: data curation (equal), methodology (equal), writing – review and editing (equal). Niels M. Schmidt: data curation (equal), methodology (equal), writing – review and editing (equal). Michael J. Suitor: data curation (equal), methodology (equal), writing – review and editing (equal). Joëlle Taillon: data curation (equal), methodology (equal), writing – review and editing (equal). Matilde Tomaselli: data curation (equal), methodology (equal), writing – review and editing (equal). Susan J. Kutz: conceptualization (equal), data curation (equal), methodology (equal), visualization (equal), writing – original draft (equal), writing – review and editing (equal).
Conflicts of Interest
The authors declare no conflicts of interest.
Statement on Inclusion
Our study brings together authors based in the countries where the study was carried out. All authors were engaged early on with the research and study design to ensure that the diverse sets of perspectives they represent were considered from the onset. The study builds on local management plans and published literature, as well as the knowledge and perspectives of Indigenous communities. Results of this study have been communicated to Indigenous communities and local wildlife co‐management organisations.
Supporting information
Appendix S1.
Acknowledgements
We thank everyone who collected qiviut samples for this study, including but not limited to: Steve Arthur, Tony Gorn, Beth Lenart, Lincoln Parrett, Patrick Jones and Brynn Parr (Alaska); Martin Kienzler, Marc Cattet, Brett Elkin, Todd Shury, Kevin Michener, and David Tavares (Yukon); Vincent Brodeur and Rachel Guindon (Nunavik); Lars Holst Hansen and Jannik Hansen (Greenland Ecosystem Monitoring Program, Zackenberg and Aarhus University) and Ekaluktutiak Hunters & Trappers Organisation and Kugluktuk Angoniatit Association (Nunavut), Olokhaktomiut Hunters & Trappers Committee (Northwest Territories), and Parks Canada. We thank Angie Schneider, Consuelo Grassi, Anshula Revo, Hadjira Hamou and James Wang in Canada, and David Baqué (ICP‐OES, CRBE), Fred Candaudap and Aurélie Marquet (Service ICP‐MS OMP) in France, for assistance in the laboratory. We acknowledge the Carlsberg Foundation (CF17‐0097 and CF18‐0279), Brødrene Hartmann Foundation (A32156), Polar Knowledge Canada (NST‐2122‐0049), Caribou Ungava, Ministère des Forêts, de la Faune et des Parcs Quebec, NSERC, Agence National de la Recherche ATCAF (ANR‐21‐CE34‐0001) and NSERC Northern supplement (to S.J.K.) for their financial support for this study.
Funding: This work was supported by Carlsberg Foundation (CF17‐0097 and CF18‐0279), Brødrene Hartmann Foundation (A32156), Polar Knowledge Canada (NST‐2122‐0049), Caribou Ungava, Ministère des Forêts, de la Faune et des Parcs Quebec, NSERC, Agence National de la Recherche ATCAF (ANR‐21‐CE34‐0001) and NSERC Northern supplement (to S.J.K.).
Data Availability Statement
Data and code are available to access on GitHub by following https://github.com/ERDickinson0/muskox_elements.
References
- Afema, J. A. , Beckmen K. B., Arthur S. M., Huntington K. B., and Mazet J. A.. 2017. “Disease Complexity in a Declining Alaskan Muskox (Ovibos moschatus) Population.” Journal of Wildlife Diseases 53, no. 2: 311–329. [DOI] [PubMed] [Google Scholar]
- Alaska Department of Fish and Game . 2017. The Status of Muskox and Factors Influencing Their Populations. Division of Wildlife Conservation, Annual Performance Report 1, June 2017, Federal Aid in Wildlife Restoration Project 16.0, Juneau.
- Aschner, J. L. , and Aschner M.. 2005. “Nutritional Aspects of Manganese Homeostasis.” Molecular Aspects of Medicine 26, no. 4–5: 353–362. [DOI] [PMC free article] [PubMed] [Google Scholar]
- Ayotte, J. B. , Parker K. L., Arocena J. M., and Gillingham M. P.. 2006. “Chemical Composition of Lick Soils: Functions of Soil Ingestion by Four Ungulate Species.” Journal of Mammalogy 87, no. 5: 878–888. [Google Scholar]
- Barboza, P. S. , Van Someren L. L., Gustine D. D., and Bret‐Harte M. S.. 2018. “The Nitrogen Window for Arctic Herbivores: Plant Phenology and Protein Gain of Migratory Caribou (Rangifer tarandus).” Ecosphere 9, no. 1: e02073. [Google Scholar]
- Bates, D. , Mächler M., Bolker B., and Walker S.. 2015. “Fitting Linear Mixed‐Effects Models Using lme4.” Journal of Statistical Software 67, no. 1: 1–48. [Google Scholar]
- Bauer, S. , and Hoye B. J.. 2014. “Migratory Animals Couple Biodiversity and Ecosystem Functioning Worldwide.” Science 344, no. 6179: 1242552. [DOI] [PubMed] [Google Scholar]
- Becker, R. A. , Chambers J. M., and Wilks A. R.. 1988. The New S Language. Wadsworth & Brooks/Cole, Springer. [Google Scholar]
- Blakley, B. R. , Kutz S. J., Tedesco S. C., and Flood P. F.. 2000. “Trace Mineral and Vitamin Concentrations in the Liver and Serum of Wild Muskoxen From Victoria Island.” Journal of Wildlife Diseases 36, no. 2: 301–307. [DOI] [PubMed] [Google Scholar]
- Brodeur, A. , Leblond M., Brodeur V., Taillon J., and Côté S. D.. 2023. “Investigating Potential for Competition Between Migratory Caribou and Introduced Muskoxen.” Journal of Wildlife Management 87, no. 3: e22366. [Google Scholar]
- Carpio, A. J. , Apollonio M., and Acevedo P.. 2021. “Wild Ungulate Overabundance in Europe: Contexts, Causes, Monitoring and Management Recommendations.” Mammal Review 51, no. 1: 95–108. [Google Scholar]
- Ceacero, F. , Landete‐Castillejos T., García A. J., et al. 2009. “Free‐Choice Mineral Consumption in Iberian Red Deer (Cervus elaphus hispanicus) Response to Diet Deficiencies.” Livestock Science 122, no. 2–3: 345–348. [Google Scholar]
- Cluff, D. , Goodman S., and Croft B.. 2019. A muskox survey in the East Arm area of Great Slave Lake, Northwest Territories, Canada, in late winter 2018. [Unpublished Report]. Department of Natural Resources, GNWT. [Google Scholar]
- Combs, D. K. , Goodrich R. D., and Meiske J. A. C.. 1982. “Mineral Concentrations in Hair as Indicators of Mineral Status: A Review.” Journal of Animal Science 54, no. 2: 391–398. [DOI] [PubMed] [Google Scholar]
- Combs, D. K. 1987. “Hair Analysis as an Indicator of Mineral Status of Livestock.” Journal of Animal Science 65, no. 6: 1753–1758. [DOI] [PubMed] [Google Scholar]
- Couriot, O. H. , Cameron M. D., Joly K., et al. 2023. “Continental Synchrony and Local Responses: Climatic Effects on Spatiotemporal Patterns of Calving in a Social Ungulate.” Ecosphere 14, no. 1: e4399. [Google Scholar]
- Cunningham, I. J. , and Hogan K. G.. 1958. “The Influence of Diet on the Copper and Molybdenum Contents of Hair, Hoof and Wool.” New Zealand Journal of Agricultural Research 1, no. 6: 841–846. [Google Scholar]
- Cuyler, C. , Rowell J., Adamczewski J., et al. 2020. “Muskox Status, Recent Variation, and Uncertain Future.” Ambio 49, no. 3: 805–819. [DOI] [PMC free article] [PubMed] [Google Scholar]
- Davison, T. , and Baryluk S.. 2021. Aerial Survey of Muskoxen (Ovibos moschatus) and Peary Caribou (Rangifer tarandus pearyi) on Banks Island, July and August 2019 (Manuscript number 295). Environment and Natural Resources, Government of the Northwest Territories. [Google Scholar]
- Davison, T. M. , and Williams J.. 2022. Aerial survey of muskoxen (Ovibos moschatus) and Peary caribou (Rangifer tarandus pearyi) on Northwest Victoria Island, May 2019. (Manuscript number 303). Environment and Natural Resources, Government of the Northwest Territories. [Google Scholar]
- DeCesare, N. J. , Hebblewhite M., Bradley M., Smith K. G., Hervieux D., and Neufeld L.. 2012. “Estimating Ungulate Recruitment and Growth Rates Using Age Ratios.” Journal of Wildlife Management 76, no. 1: 144–153. [Google Scholar]
- Desforges, J.‐P. , Marques G. M., Beumer L. T., et al. 2019. “Quantification of the Full Lifecycle Bioenergetics of a Large Mammal in the High Arctic.” Ecological Modelling 401: 27–39. 10.1016/j.ecolmodel.2019.03.013. [DOI] [Google Scholar]
- Desforges, J. P. , Marques G. M., Beumer L. T., et al. 2021. “Environment and Physiology Shape Arctic Ungulate Population Dynamics.” Global Change Biology 27, no. 9: 1755–1771. [DOI] [PubMed] [Google Scholar]
- Di Francesco, J. , Kwong G. P., Deardon R., et al. 2022. “Qiviut Cortisol Is Associated With Metrics of Health and Other Intrinsic and Extrinsic Factors in Wild Muskoxen (Ovibos moschatus).” Conservation Physiology 10, no. 1: coab103. [DOI] [PMC free article] [PubMed] [Google Scholar]
- Durkalec, M. , Nawrocka A., Krzysiak M., Larska M., Kmiecik M., and Posyniak A.. 2018. “Trace Elements in the Liver of Captive and Free‐Ranging European Bison (Bison bonasus L.).” Chemosphere 193: 454–463. [DOI] [PubMed] [Google Scholar]
- Flood, P. F. , Stalker M. J., and Rowell J. E.. 1989. “The Hair Follicle Density and Seasonal Shedding Cycle of the Muskox (Ovibos moschatus).” Canadian Journal of Zoology 67: 1143–1147. [Google Scholar]
- Flueck, W. T. 1994. “Effect of Trace Elements on Population Dynamics: Selenium Deficiency in Free‐Ranging Black‐Tailed Deer.” Ecology 75: 807–812. [Google Scholar]
- Flueck, W. T. , Smith‐Flueck J. M., Mionczynski J., and Mincher B. J.. 2012. “The Implications of Selenium Deficiency for Wild Herbivore Conservation: A Review.” European Journal of Wildlife Research 58: 761–780. [Google Scholar]
- Flynn, A. , Franzmann A. W., Arneson P. D., and Oldemeyer J. L.. 1977. “Indications of Copper Deficiency in a Subpopulation of Alaskan Moose.” Journal of Nutrition 107, no. 7: 1182–1189. [DOI] [PubMed] [Google Scholar]
- Forchhammer, M. C. , and Boomsma J. J.. 1995. “Foraging Strategies and Seasonal Diet Optimization of Muskoxen in West Greenland.” Oecologia 104, no. 2: 169–180. [DOI] [PubMed] [Google Scholar]
- Forchhammer, M. C. , Post E., Stenseth N. C., and Boertmann D. M.. 2002. “Long‐Term Responses in Arctic Ungulate Dynamics to Changes in Climatic and Trophic Processes.” Population Ecology 44, no. 2: 113–120. [Google Scholar]
- French, A. S. , Shaw D., Gibb S. W., and Taggart M. A.. 2017. “Geochemical Landscapes as Drivers of Trace and Toxic Element Profiles in Wild Red Deer (Cervus elaphus).” Science of the Total Environment 601: 1606–1618. [DOI] [PubMed] [Google Scholar]
- Gaillard, J. M. , Festa‐Bianchet M., Yoccoz N. G., Loison A., and Toigo C.. 2000. “Temporal Variation in Fitness Components and Population Dynamics of Large Herbivores.” Annual Review of Ecology and Systematics 31: 367–393. [Google Scholar]
- Gamberg, M. , Cuyler C., and Wang X.. 2016. “Contaminants in Two West Greenland Caribou Populations.” Science of the Total Environment 554: 329–336. [DOI] [PubMed] [Google Scholar]
- García‐Barrera, T. , Gomez‐Ariza J. L., Gonzalez‐Fernandez M., Moreno F., Carcia Sevillano M. A., and Gomez‐Jacinto V.. 2012. “Biological Responses Related to Agonistic, Antagonistic and Synergistic Interactions of Chemical Species.” Analytical and Bioanalytical Chemistry 403, no. 8: 2237–2253. [DOI] [PubMed] [Google Scholar]
- Grace, N. D. , and Wilson P. R.. 2002. “Trace Element Metabolism, Dietary Requirements, Diagnosis and Prevention of Deficiencies in Deer.” New Zealand Veterinary Journal 50, no. 6: 252–259. [DOI] [PubMed] [Google Scholar]
- Ghorbani, A. , Mohit A., and Kuhi H. D.. 2015. “Effects of Dietary Mineral Intake on Hair and Serum Mineral Contents of Horses.” Journal of Equine Veterinary Science 35, no. 4: 295–300. [Google Scholar]
- Gustine, D. D. , Barboza P. S., Lawler J. P., et al. 2011. “Characteristics of Foraging Sites and Protein Status in Wintering Muskoxen: Insights From Isotopes of Nitrogen.” Oikos 120, no. 10: 1546–1556. [Google Scholar]
- Handeland, K. , Bernhoft A., and Aartun M. S.. 2008. “Copper Deficiency and Effects of Copper Supplementation in a Herd of Red Deer (Cervus elaphus).” Acta Veterinaria Scandinavica 50, no. 1: 1–4. [DOI] [PMC free article] [PubMed] [Google Scholar]
- Herdt, T. H. , and Hoff B.. 2011. “The Use of Blood Analysis to Evaluate Trace Mineral Status in Ruminant Livestock.” Veterinary Clinics: Food Animal Practice 27, no. 2: 255–283. [DOI] [PubMed] [Google Scholar]
- Herrada, A. , Bariod L., Saïd S., et al. 2024. “Minor and Trace Element Concentrations in Roe Deer Hair: A Non‐invasive Method to Define Reference Values in Wildlife.” Ecological Indicators 159: 111720. [Google Scholar]
- Hidiroglou, M. 1979. “Trace Element Deficiencies and Fertility in Ruminants: A Review.” Journal of Dairy Science 62, no. 8: 1195–1206. [DOI] [PubMed] [Google Scholar]
- Illius, A. W. , and O'Connor T. G.. 2000. “Resource Heterogeneity and Ungulate Population Dynamics.” Oikos 89, no. 2: 283–294. [Google Scholar]
- Jutha, N. , Jardine C., Schwantje H., Mosbacher J., Kinniburgh D., and Kutz S.. 2022. “Evaluating the Use of Hair as a Non‐invasive Indicator of Trace Mineral Status in Woodland Caribou (Rangifer tarandus caribou).” PLoS One 17, no. 6: e0269441. [DOI] [PMC free article] [PubMed] [Google Scholar]
- Kauffman, M. J. , Aikens E. O., Esmaeili S., et al. 2021. “Causes, Consequences, and Conservation of Ungulate Migration.” Annual Review of Ecology, Evolution, and Systematics 52: 453–478. [Google Scholar]
- Kellaway, R. C. , Sitorus P., and Leibholz J. M. L.. 1978. “The Use of Copper Levels in Hair to Diagnose Hypocuprosis.” Research in Veterinary Science 24, no. 3: 352–357. [PubMed] [Google Scholar]
- Klein, D. R. , and Thing H.. 1989. “Chemical Elements in Mineral Licks and Associated Muskoxen Feces in Jameson Land, Northeast Greenland.” Canadian Journal of Zoology 67, no. 5: 1092–1095. [Google Scholar]
- Kutz, S. J. , Ducrocq J., Cuyler C., et al. 2013. “Standardized Monitoring of Rangifer Health During International Polar Year.” Rangifer 33: 91–114. [Google Scholar]
- Leclerc, L. 2015. Muskox (Ovibos moschatus) Distribution and Abundance, Muskox Management Units MX‐07, Victoria Island, September 2013–2014. Nunavut Department of Environment Status Report. [Google Scholar]
- Leclerc, L. 2018. Muskox (Ovibos moschatus) Distribution and Abundance, Muskox Management Units MX09, West of the Coppermine River, August 2017. Nunavut Department of Environment Status Report. [Google Scholar]
- Littledike, E. T. , and Goff J.. 1987. “Interactions of Calcium, Phosphorus, Magnesium and Vitamin D That Influence Their Status in Domestic Meat Animals.” Journal of Animal Science 65, no. 6: 1727–1743. [DOI] [PubMed] [Google Scholar]
- Mallory, C. D. , and Boyce M. S.. 2018. “Observed and Predicted Effects of Climate Change on Arctic Caribou and Reindeer.” Environmental Reviews 26, no. 1: 13–25. [Google Scholar]
- Montillo, M. , Caslini C., Peric T., et al. 2019. “Analysis of 19 Minerals and Cortisol in Red Deer Hair in Two Different Areas of the Stelvio National Park: A Preliminary Study.” Animals 9, no. 8: 492. [DOI] [PMC free article] [PubMed] [Google Scholar]
- Mosbacher, J. B. , Desforges J. P., Michelsen A., et al. 2022. “Hair Mineral Levels as Indicator of Wildlife Demographics?—A Pilot Study of Muskoxen.” Polar Research 41: 9154. [Google Scholar]
- National Research Council . 2007. Nutrient Requirements of Small Ruminants: Sheep, Goats, Cervids, and New World Camelids. National Academies Press. [Google Scholar]
- Newby, J. R. , and DeCesare N. J.. 2020. “Multiple Nutritional Currencies Shape Pregnancy in a Large Herbivore.” Canadian Journal of Zoology 98, no. 5: 307–315. [Google Scholar]
- Nieder, R. , Benbi D. K., Reichl F. X., Nieder R., Benbi D. K., and Reichl F. X.. 2018. “Macro‐and Secondary Elements and Their Role in Human Health.” In Soil Components and Human Health, 257–315. Springer. [Google Scholar]
- O'Hara, T. M. , Carroll G., Barboza P., et al. 2001. “Mineral and Heavy Metal Status as Related to a Mortality Event and Poor Recruitment in a Moose Population in Alaska.” Journal of Wildlife Diseases 37, no. 3: 509–522. [DOI] [PubMed] [Google Scholar]
- Oropesa, A. L. , Ramos A., and Gómez L. J.. 2022. “Toxic and Essential Metal Levels in the Hair of Red Deer (Cervus elaphus) and Wild Boar (Sus scrofa) for Monitoring the Contamination in Protected Areas of South‐Western Spain.” Environmental Science and Pollution Research 29, no. 18: 27430–27442. [DOI] [PubMed] [Google Scholar]
- Osredkar, J. , and Sustar N.. 2011. “Copper and Zinc, Biological Role and Significance of Copper/Zinc Imbalance.” Journal Clinical Toxicology 3, no. 2161: 0495. [Google Scholar]
- Oster, K. W. , Barboza P. S., Gustine D. D., Joly K., and Shively R. D.. 2018. “Mineral Constraints on Arctic Caribou (Rangifer tarandus): A Spatial and Phenological Perspective.” Ecosphere 9, no. 3: e02160. [Google Scholar]
- Pascual‐Rico, R. , Morales‐Reyes Z., Aguilera‐Alcalá N., et al. 2021. “Usually Hated, Sometimes Loved: A Review of Wild Ungulates' Contributions to People.” Science of the Total Environment 801: 149652. [DOI] [PubMed] [Google Scholar]
- Peacock, S. J. , Mavrot F., Tomaselli M., et al. 2020. “Linking Co‐Monitoring to Co‐Management: Bringing Together Local, Traditional, and Scientific Knowledge in a Wildlife Status Assessment Framework.” Arctic Science 6, no. 3: 247–266. [Google Scholar]
- Puls, R. 1994. Mineral Levels in Animal Health: Diagnostic Data, 238. Sherpa International. [Google Scholar]
- R Core Team . 2023. R: A Language and Environment for Statistical Computing. R Foundation for Statistical Computing. https://www.R‐project.org/. [Google Scholar]
- Rakic, F. , Fernandez‐Aguilar X., Pruvot M., et al. 2023. “Variation of Hair Cortisol in Two Herds of Migratory Caribou (Rangifer tarandus): Implications for Health Monitoring.” Conservation Physiology 11, no. 1: coad030. [DOI] [PMC free article] [PubMed] [Google Scholar]
- Rice, J. C. , and Rochet M. J.. 2005. “A Framework for Selecting a Suite of Indicators for Fisheries Management.” ICES Journal of Marine Science 62, no. 3: 516–527. [Google Scholar]
- Rioux, E. , Pelletier F., Mosbacher J. B., et al. 2022. “Links Between Individual Performance, Trace Elements and Stable Isotopes in an Endangered Caribou Population.” Global Ecology and Conservation 38: e02234. [Google Scholar]
- Rombach, E. P. , Barboza P. S., and Blake J. E.. 2003. “Costs of Gestation in an Arctic Ruminant: Copper Reserves in Muskoxen.” Comparative Biochemistry and Physiology Part C: Toxicology & Pharmacology 134, no. 1: 157–168. [DOI] [PubMed] [Google Scholar]
- Ropstad, E. , Johansen O., Halse K., Morberg H., and Dahl E.. 1997. “Plasma Magnesium, Calcium and Inorganic Phosphorus in Norwegian Semi‐Domestic Female Reindeer (Rangifer tarandus tarandus) on Winter Pastures.” Acta Veterinaria Scandinavica 38, no. 4: 299–313. [DOI] [PMC free article] [PubMed] [Google Scholar]
- Roug, A. , Swift P. K., Gerstenberg G., et al. 2015. “Comparison of Trace Mineral Concentrations in Tail Hair, Body Hair, Blood, and Liver of Mule Deer (Odocoileus hemionus) in California.” Journal of Veterinary Diagnostic Investigation 27, no. 3: 295–305. [DOI] [PubMed] [Google Scholar]
- Scaletti, R. W. , Trammell D. S., Smith B. A., and Harmon R. J.. 2003. “Role of Dietary Copper in Enhancing Resistance to Escherichia coli Mastitis.” Journal of Dairy Science 86, no. 4: 1240–1249. [DOI] [PubMed] [Google Scholar]
- Schmidt, I. K. , Jonasson S., Shaver G., Michelsen A., and Nordin A.. 2002. “Mineralization and Distribution of Nutrients in Plants and Microbes in Four Arctic Ecosystems: Responses to Warming.” Plant and Soil 242: 93–106. [Google Scholar]
- Schmidt, N. M. , Michelsen A., Hansen L. H., et al. 2023. “Sequential Analysis of δ15N in Guard Hair Suggests Late Gestation Is the Most Critical Period for Muskox Calf Recruitment.” Rapid Communications in Mass Spectrometry 37, no. 6: e9470. [DOI] [PMC free article] [PubMed] [Google Scholar]
- Schmidt, N. M. , van Beest F. M., Mosbacher J. B., et al. 2016. “Ungulate Movement in an Extreme Seasonal Environment: Year‐Round Movement Patterns of High‐Arctic Muskoxen.” Wildlife Biology 22, no. 6: 253–267. [Google Scholar]
- Sharma, M. C. , Joshi C., Das G., and Hussain K.. 2007. “Mineral Nutrition and Reproductive Performance of the Dairy Animals: A Review.” Indian Journal of Animal Sciences 77, no. 7: 599–608. [Google Scholar]
- Soetan, K. O. , Olaiya C. O., and Oyewole O. E.. 2010. “The Importance of Mineral Elements for Humans, Domestic Animals and Plants: A Review.” African Journal of Food Science 4, no. 5: 200–222. [Google Scholar]
- Staaland, H. , and White R. G.. 2001. “Regional Variation in Mineral Contents of Plants and Its Significance for Migration by Arctic Reindeer and Caribou.” Alces 37, no. 2: 497–509. [Google Scholar]
- Stoklasová, L. , Váhala J., and Hejcmanová P.. 2020. “Minerals in the Blood, Hair, and Faeces of the Critically Endangered Western Derby Eland Under Human Care in Two Wildlife Reserves in Senegal.” Biological Trace Element Research 195, no. 1: 105–109. [DOI] [PubMed] [Google Scholar]
- Sullivan, J. H. , Warkentin M., and Wallace L.. 2021. “So Many Ways for Assessing Outliers: What Really Works and Does It Matter?” Journal of Business Research 132: 530–543. [Google Scholar]
- Tajchman, K. , Steiner‐Bogdaszewska Ż., and Żółkiewski P.. 2018. “Requirements and Role of Selected Micro and Macro Elements in Nutrition of Cervids (Cervidae)—Review.” Applied Ecology and Environmental Research 16, no. 6: 7669–7686. [Google Scholar]
- Todorov, V. 2007. “Robust Selection of Variables in Linear Discriminant Analysis.” Statistical Methods and Applications 15, no. 3: 395–407. [Google Scholar]
- Tomaselli, M. , Kutz S., Gerlach C., and Checkley S.. 2018. “Local Knowledge to Enhance Wildlife Population Health Surveillance: Conserving Muskoxen and Caribou in the Canadian Arctic.” Biological Conservation 217: 337–348. [Google Scholar]
- Trouwborst, A. 2019. “Global Large Herbivore Conservation and International Law.” Biodiversity and Conservation 28: 3891–3914. [Google Scholar]
- Underwood, E. 2012. Trace Elements in Human and Animal Nutrition. 5th ed. Academic Press. [Google Scholar]
- van Beest, F. M. , Schmidt N. M., Stewart L., et al. 2023. “Geochemical Landscapes as Drivers of Wildlife Reproductive Success: Insights From a High‐Arctic Ecosystem.” Science of the Total Environment 903: 166567. [DOI] [PubMed] [Google Scholar]
- Venables, W. N. , and Ripley B. D.. 2002. Modern Applied Statistics With S. 4th ed. Springer. [Google Scholar]
- Webster, A. B. , Callealta F. J., Ganswindt A., and Bennett N. C.. 2021. “A Non‐invasive Assessment of Essential Trace Element Utilization at Different Trophic Levels in African Wildlife.” Journal of Environmental Management 293: 112820. [DOI] [PubMed] [Google Scholar]
- White, R. G. , Russell D. E., and Daniel C. J.. 2014. “Simulation of Maintenance, Growth and Reproduction of Caribou and Reindeer as Influenced by Ecological Aspects of Nutrition, Climate Change and Industrial Development Using an Energy‐Protein Model.” Rangifer 34, no. 22: 1–126. [Google Scholar]
Associated Data
This section collects any data citations, data availability statements, or supplementary materials included in this article.
Supplementary Materials
Appendix S1.
Data Availability Statement
Data and code are available to access on GitHub by following https://github.com/ERDickinson0/muskox_elements.