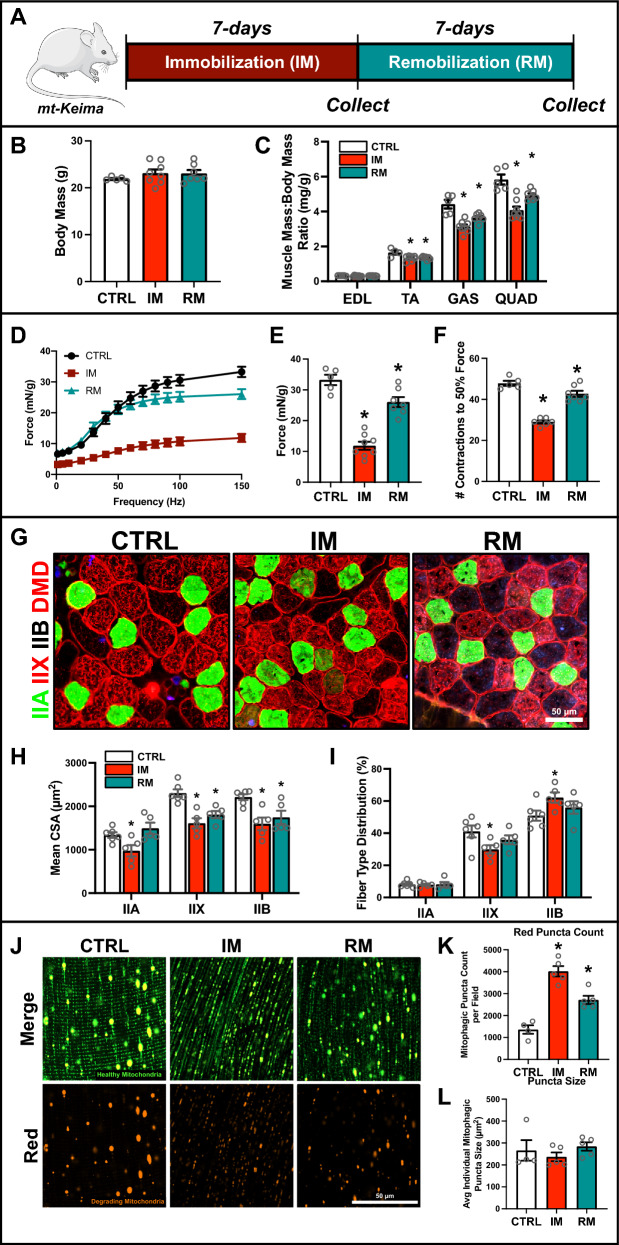
Fig. 2.
Changes in skeletal muscle structure and mitophagic flux in IM and RM muscle. A Representative visualization of immobilization and remobilization protocol. B Body mass of control (CTRL), immobilized (IM), and remobilized (RM) mice. C Skeletal muscle mass of tibialis anterior (TA), extensor digitorum longus (EDL), gastrocnemius (GAS), and quadriceps (QUAD) normalized to body mass. D Muscle force-frequency graph from CTRL, IM, and RM mice. E Peak force development derived from force-frequency curve and F fatigue index measurement of EDL (greater value indicates more fatigue-resistance). G Representative immunofluorescent images of muscle from CTRL, IM, and RM mice. Samples were stained to identify myosin heavy chain isoform and fiber membrane: type IIA (green), type IIX (red), type IIB (unstained), and dystrophin (DMD, red). Scale bar indicates 50 μm. H Quantification of mean cross-sectional area (CSA) and I distribution of type IIA, IIX, and IIB fibers. J Representative confocal images of mitophagic flux from muscle of mt-Keima reporter mice. Green fluorescence indicates healthy mitochondria. Red fluorescence indicates degrading mitochondria. Scale bar indicates 50 μm. Quantification of K mitophagic (i.e., red) puncta count per field and L average individual mitophagic puncta size. * p < 0.05 compared to CTRL group. n = 5–8 per group

