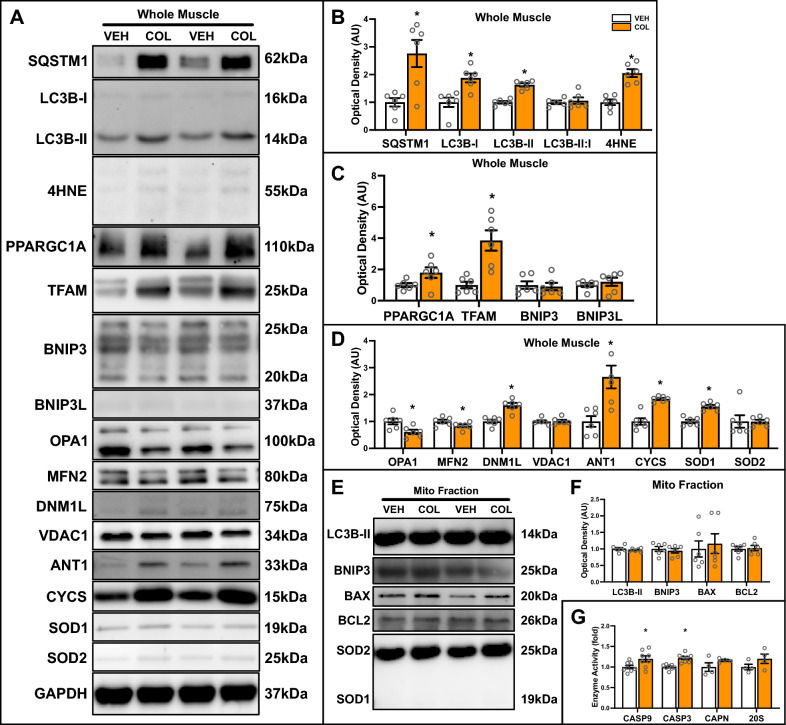
Fig. 8.
Quantitative analysis of autophagy and mitophagy proteins in VEH and COL treated IM muscle. A Representative immunoblots of whole muscle lysates. GAPDH shown as a loading control for whole muscle lysates. B Quantitative analysis of SQSTM1, LC3B-I, LC3B-II, LC3B-II:I, and 4HNE from whole muscle lysates. C Quantitative analysis of PPARGC1A, TFAM, BNIP3, and BNIP3L from whole muscle lysates. D Quantitative analysis of OPA1, MFN2, DNM1L, VDAC1, ANT1, CYCS, SOD1, and SOD2 from whole muscle lysates. E Representative immunoblots of mitochondrial fractions. SOD1 (cytosolic) and SOD2 (mitochondrial) shown to confirm purity of mitochondrial fraction. F Quantitative analysis of LC3B-II, BNIP3, BAX and BCL2 from mitochondrial-enriched fractions. G Quantitative analysis of CASP9 activity, CASP3 activity, CAPN activity, and 20S proteasome activity. * p < 0.05 compared to VEH group. n = 6–8 per group

