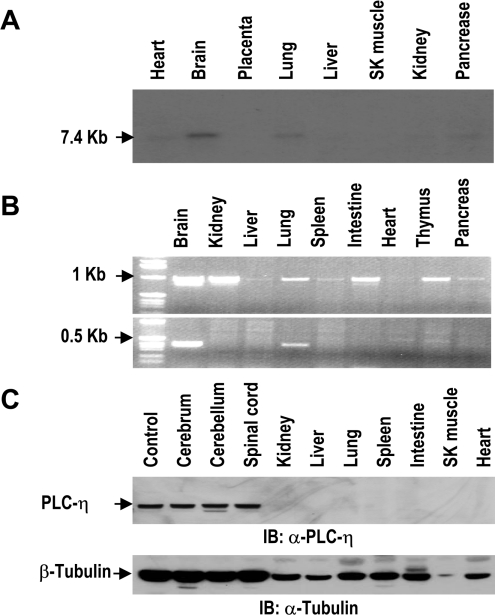
Figure 4. Tissue distributions of PLC-η.
(A) Northern-blot analysis of human tissues detected by PLC-η cDNA. SK muscle, skeletal muscle. (B) PCR analysis of PLC-η in cDNA from mouse tissues. The primer pair for common nucleotides of three splicing forms (upper panel) and the specific primer for the 23rd exon-containing cDNA (lower panel) were used in each PCR reaction. (C) Immunoblot analysis of PLC-η with mouse tissue extracts. Mouse PLC-η protein expressed in HEK-293 cells was used as a control. Immunoblot of tubulin was used as a loading control.

