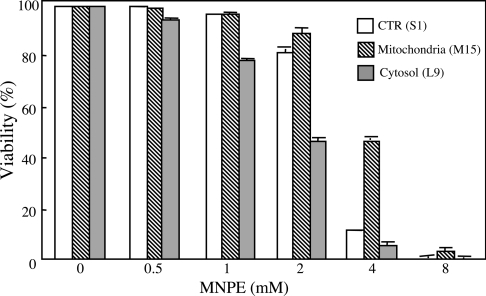
Figure 3. Effects of endoperoxides on cells overexpressing PHGPx.
Cells overexpressing PHGPx at cytoplasm (L9 cells, grey bars) or mitochondria (M15 cells, hatched bars) and control cells (S1 cells, open bars) were treated with various concentrations of MNPE for 2 h. After 22 h, viability of the cells was assessed by measuring LDH activity. CTR, control.

