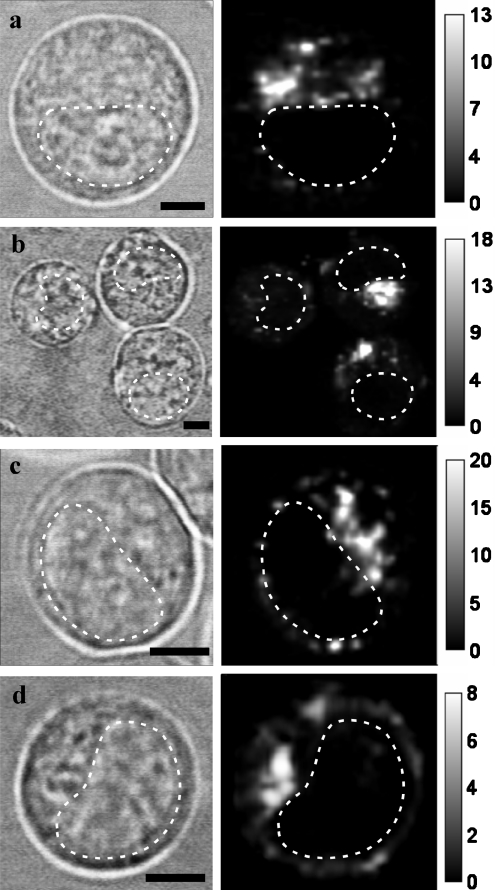
Figure 4. Typical distributions of Rh-CT1No (a), Rh-CT1Nh (b), Rh-CT2No (c) and Rh-CT3Nk (d) in living HL60 cells.
The left column shows conventional bright-field micrographs of cells (bar=5 μm). The broken line indicates the nucleus region. The right column shows confocal spectral images of Rh-CT distribution at the equatorial optical section of cells. The intensity scale corresponds to the intracellular concentration of Rh-CTs in μM. Cells were incubated with Rh-CT1No (0.5 μM), Rh-CT1Nh (1 μM), Rh-CT2No (0.5 μM) or Rh-CT3Nk (0.2 μM) for 1 h and placed under the microscope after thorough washing.

