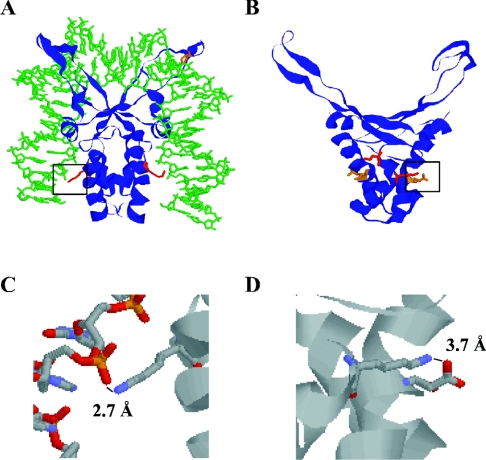
Figure 1. Comparison of TF1 and BstHU structures.
(A) Energy minimized model of TF1 (1WTU) in complex with DNA derived from the IHF-DNA structure (1IHF). Lys3, shown to contact DNA 8–9 bp distal to the DNA kinks [23] is indicated in red, and the DNA-intercalating Pro63 is shown in orange. (B) Lys3 (red) forms a salt bridge with Asp26 (orange) in B. stearothermophilus HU (1HUE). (C) Expanded view of TF1 salt bridge between the ϵ-amino group of Lys3 and phosphate oxygen of the DNA backbone. (D) Expanded view of the surface salt bridge between Lys3 and Asp26 of BstHU. In (C, D), nitrogen is coloured blue, oxygen is red, carbon is grey, and phosphorous is orange. Expanded views are identified in (A, B) by a black frame.

