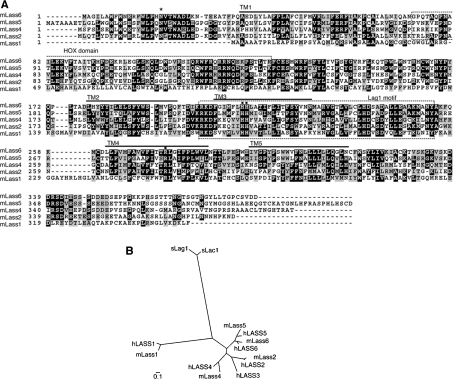
Figure 1. Sequence comparison of five mouse Lass family members.
(A) Amino acid sequence alignment for mouse proteins Lass1, Lass2, Lass4, Lass5 and Lass6. GenBank® accession numbers are shown in Table 1. The alignment was generated using the ClustalW (http://www.ch.embnet.org/software/ClustalW.html) and BOXSHADE (http://www.ch.embnet.org/software/BOX_form.html) programs. Black boxes indicate identical residues, and grey boxes show amino acid similarity. Lass6 transmembrane segments (TM1–TM5) predicted by TopPredII are underlined [23]. The HOX domain and Lag1 motif are indicated and enclosed in boxes formed by broken lines. The conserved His and Arg residues (■) and the conserved N-glycosylation site (*) are indicated. (B) Dendrogram of the known mouse (m) and human (h) Lass family members and yeast (s) Lag1p/Lac1p. Sequences from the Lass family members of mouse, human and yeast were aligned using ClustalW. GenBank® accession numbers of the mouse family members are shown in Table 1. The GenBank accession numbers for human Lass family members are M62302 (hLASS1), BC010032 (hLASS2), BC010032 (hLASS3), AK022151 (hLASS4), BC032565 (hLASS5) and BC030800 (hLASS6), and those for yeast Lag1p/Lac1p members are NP_011860 (sLag1p) and NP_012917(sLac1p). The scale bar indicates the genetic distance for 0.1 amino acid substitution per site.

