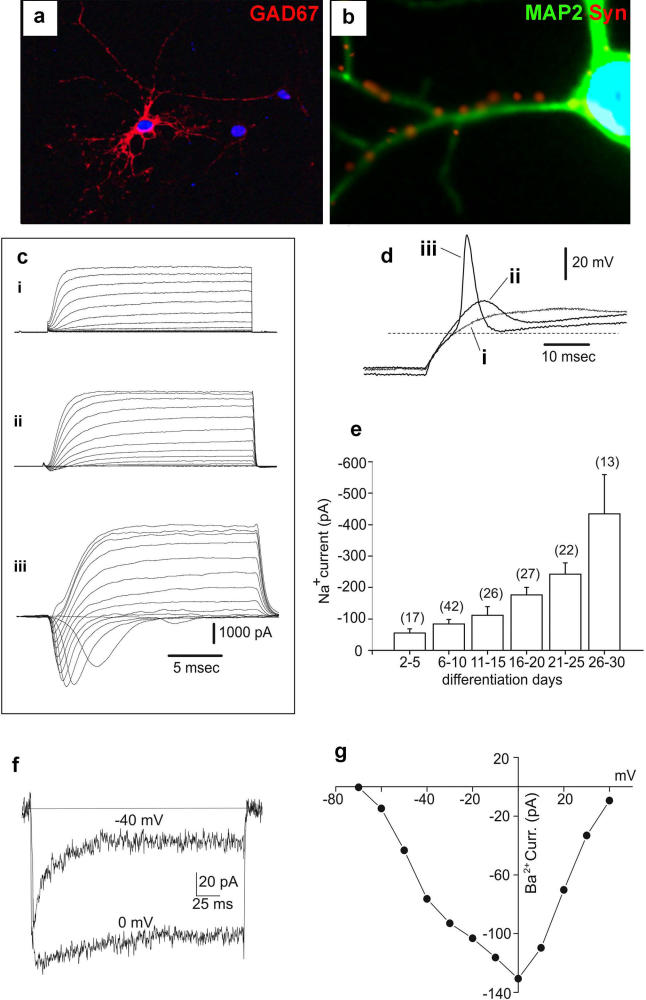
Figure 4. Phenotype and Electrical Activity of NS Cell–Derived Neurons.
(A) This LC1 NS cell–derived neuron at 27 d of differentiation displays mature morphology and expresses GAD67.
(B) Expression of MAP2/synaptophysin after 7 d of differentiation.
(C) Superimposed inward and outward current tracings obtained at different membrane potentials (between −70 and +40 mV from a holding potential of −90 mV), from NS cell–derived neurons after differentiation for 6 (i), 20 (ii), and 30 d (iii).
(D) Superimposed voltage responses obtained following injection of depolarising rectangular current pulses in the same three cells (i–iii) by switching from voltage- to current-clamp immediately after current recordings shown in (c) were obtained. The dashed line represents a voltage level of −60 mV.
(E)Average Na+ currents elicited at −20 mV from cells cultured in differentiating medium for increasing times as indicated by labels. Bars indicate SE.
(F) Superimposed inward currents elicited at −40 mV and 0 mV in 10 mM Ba2+ and in the presence of TTX; the holding potential was −90 mV.
(G) Current/voltage relationship from the same cell as in (F).

