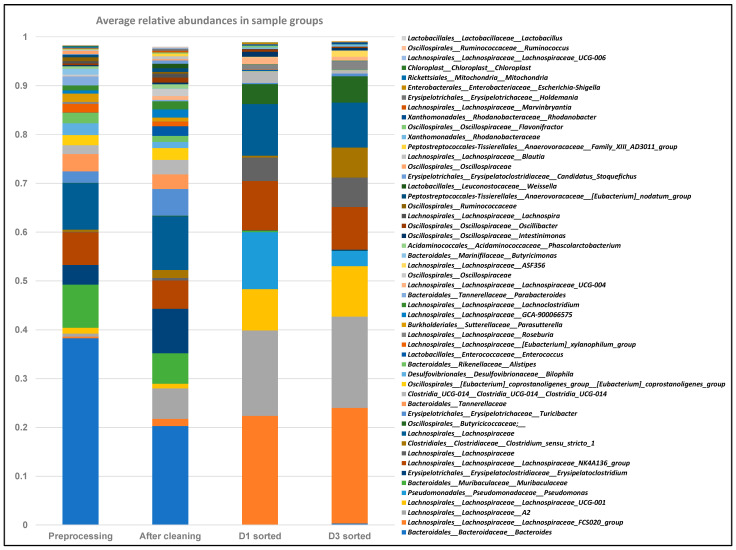
Figure 7.
Relative abundance of fecal bacterial taxa in FACS bacteria based on 16S rRNA gene sequencing. Y-axis represents average relative abundance of 49 bacterial operational taxonomic units (OTUs) identified in fecal samples of five mice at relative abundance of at least 0.5% in at least one sample. Different time points where 16S sequencing analyses were carried out are shown on X-axis. The “pre-inoculation” stacked bar shows reference average gut microbial community before inoculating mice with donor bacterium E. coli LM715-1 carrying RP4 plasmid. The “D1 after cleaning” stacked bar shows average day 1 microbial community before FACS but after washing fecal samples. The “D1 sorted” and “D3 sorted” stacked bars show average relative abundances of putative transconjugant bacteria identified on day 1 and day 3 post inoculation of mice with donor E. coli LM715-1 after two-stage sorting, as described in the Section 4. Mitochondrial and chloroplast sequences were eliminated from the dataset.

