Figure 1.
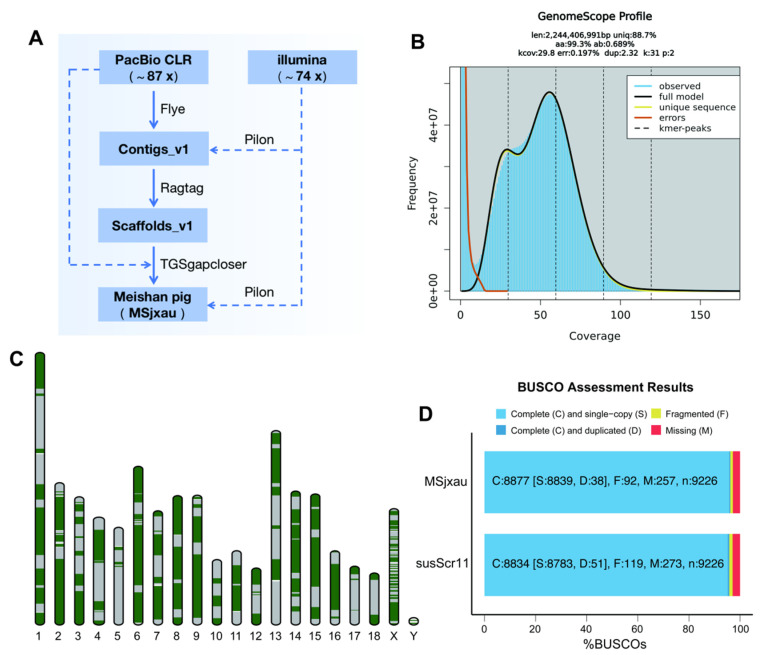
The genome assembly of the Meishan pig. (A) Workflow for the genome assembly of Meishan pig. (B) The frequency distribution of k-mer for Meishan pig genome (k = 31). (C) The distribution of contigs on the chromosome, with green and gray representing different contigs. (D) BUSCO evaluates the completeness of genome assembly.

