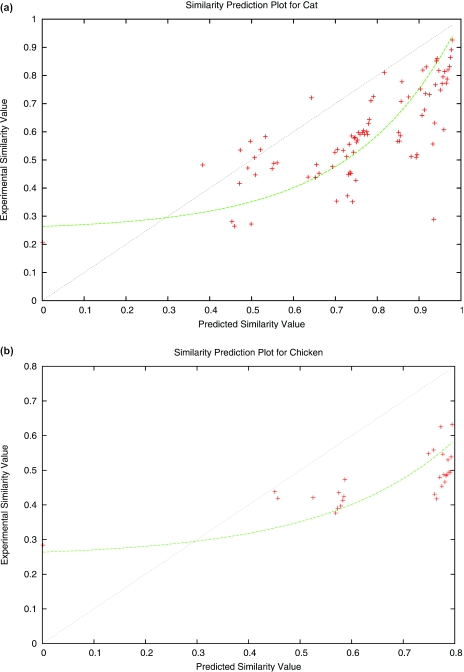
Figure 3.
Plots of predicted versus experimental profile values. For use in correcting predictions of profile values, we plotted predicted versus experimental values of (a) pid for cat and (b) pid for chicken. Although not shown, we examined plots for other species, which are similar. Plots for ppresent did not obey an immediate pattern and thus did not lead us to change our predictions. Each cross represents a plotted data point; shown also is the function we used for converting our initial predictions of pid to our final predictions, as well as the linear fit that would be suitable if our predictions matched the experimental values.

