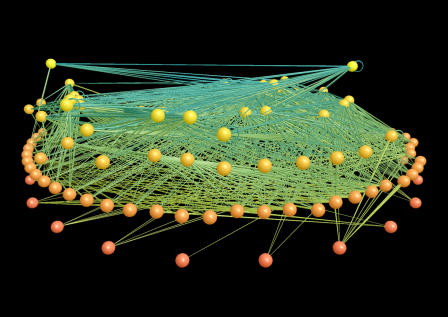
Figure 1. The Network of Trophic Interactions for Little Rock Lake, Wisconsin.
Figure shows 997 feedings links (lines) among 92 taxa (nodes) [2]. The node color indicates the trophic level of the taxon, including (from bottom to top) algae, zooplankton, insects, and fishes; the link color corresponds to the type of feeding link, including herbivory and primary and secondary carnivory. This image was produced using FoodWeb3D software written by R. J. Williams and provided by the Pacific Ecoinformatics and Computational Ecology Lab (www.foodwebs.org).

