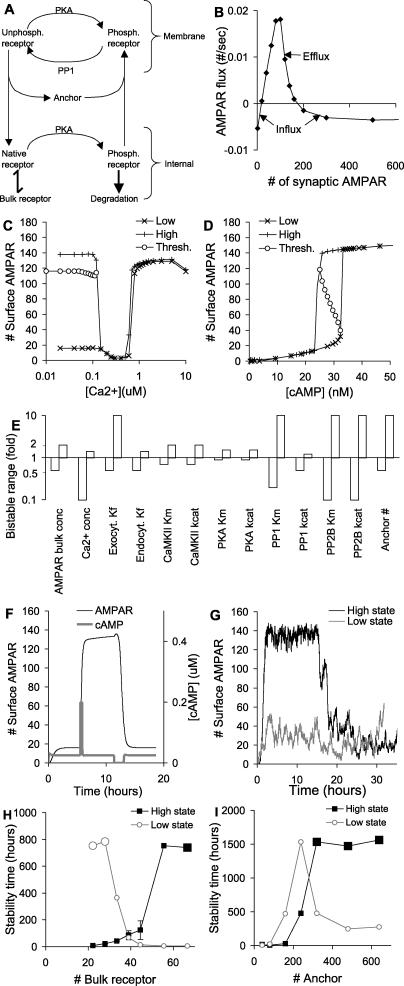
Figure 5. AMPAR Translocation and Bistability for Model 1.
(A) Simplified schematic of receptor recycling.
(B) Bistability analysis. The flux of AMPARs from the bulk AMPAR pool to the native AMPAR pool is plotted against the total number of synaptic receptors. Receptor influx into the spine occurs both at very low and at high numbers of synaptic AMPARs.
(C) States of the system as a function of Ca2+ concentration. Upper curve is obtained by starting system in state with high numbers of AMPARs in the synapse; lower curve with low numbers of AMPARs. The intermediate threshold curve is calculated using successive bisection as described in the Materials and Methods. Bistability is present when Ca2+ concentration is less than 0.12 μM. Between 0.12 and 0.6 μM the system settles to a state of low AMPAR numbers. Above 0.8 μM the system is in the high state.
(D) States of the system as a function of cAMP concentration. Steady-state number of AMPARs is calculated as in (C). There is hysteresis as the high and low states coexist for the bistable region of the curve. Threshold points (open circles) complete the characteristic S-shaped curve for a bistable system.
(E) Parameter sensitivity analysis. The bars represent the range of parameter values over which the system remains bistable. Other than key regulators, the system tolerates a 2-fold or greater range of most parameters without losing bistability.
(F) Time course of AMPAR showing two stable states. A pulse of 0.2 μM cAMP is applied for 1,000 s to trigger translocation of AMPARs to the synaptic membrane. Following this, cAMP is restored to resting levels, and the system settles to the state of high membrane AMPAR. The “off” stimulus is provided by reducing cAMP to 0 μM for 6,000 s. Following this, the system settles back to the basal state of AMPAR.
(G) Stochastic runs in low and high states. The high state is triggered by an initial cAMP pulse from t = 0 to 4,000 s. The state spontaneously turns off at around 20 h in this run, but the low state does not flip.
(H) Average stability time of low and high states for different numbers of bulk receptors (mean ± standard error of the mean). Twenty-four simulations for each state were run, as in (G). Stability time is calculated as total simulation time in selected state, divided by number of transitions out of that state. Large symbols represent cases where no transitions occurred over the entire set of simulations. As expected, a higher level of bulk receptor increases the likelihood that the spine will spontaneously turn “on”, and vice versa.
(I) Stability time in low and high states for different numbers of anchor proteins. As the number of anchor proteins increases the stability time for both states also rises. At very large numbers of anchor proteins the synapse occasionally turns “on” spontaneously. Symbols and calculations as in (H).

