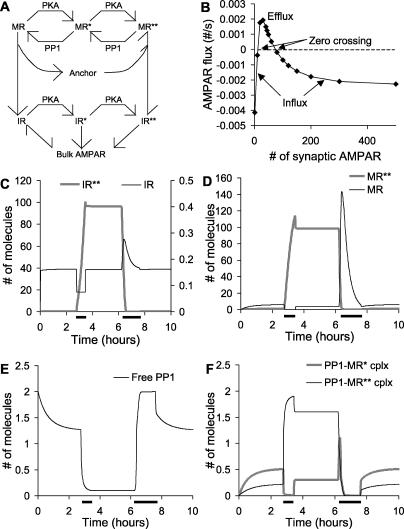
Figure 6. Simplified AMPAR Bistable Model.
IR represents internal receptor, MR represents synaptic-membrane-localised receptor and asterisks indicate phosphorylation at Ser845. PKA is protein kinase A.
(A) Complete reaction diagram.
(B) Bistability analysis for simplified model. AMPAR flux between the bulk AMPAR and the IR state from (A) is plotted against the total number of synaptic receptors (IR + IR* + IR** + MR + MR* + MR**). As seen in the complete AMPAR model in Figure 5B, there are two regions of receptor influx into the spine, at low and high numbers of synaptic AMPARs. The zero crossings are stable states where there is no net flux of receptor.
(C–F) Time courses of key molecules in simple model. After an initial settling period, PKA is raised to 40 molecules for 2,400 s to trigger receptor influx. After the system settles into the high state, PKA is set to zero molecules for 3,600 s, to return the system to basal levels. These stimuli are indicated by horizontal bars along the time axis.
(C) Internal receptor numbers. The number of receptors in the unphosphorylated form (IR) remains very close to the bulk receptor level except during transitions, when receptors enter or leave the system.
(D) Synaptic-membrane-bound receptor levels.
(E) Numbers of free PP1 decline sharply during the high state, because of enzyme saturation.
(F) Numbers of PP1 complexes with substrates. The high amount of PP1–MR** complex is complementary to the decline in free PP1, showing the saturation of the phosphatase.

