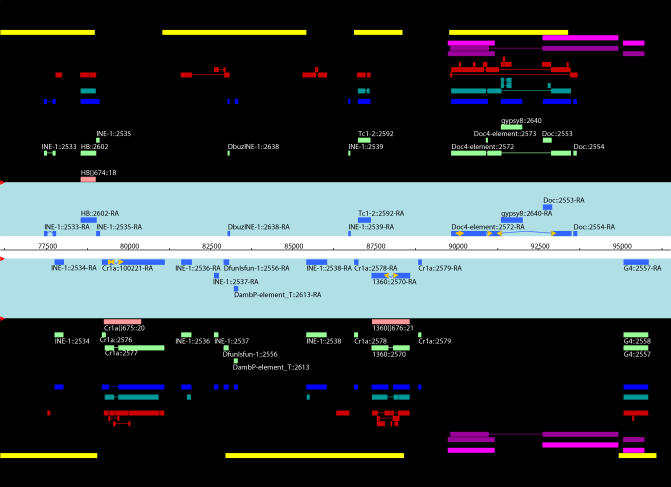
Figure 2. Screenshot of an Apollo View for a Peri-Centromeric Region with Extreme TE Density.
Curated annotations on both forward strand (top) and reverse strand (bottom) are displayed in the light blue panels. Evidence tiers are shown in the black panels: TE-HMM (yellow), RECON (light purple), BLRa (violet), BLRtx (red), BLRn (teal), RM (blue), RMBLR (light green), and Release 3.1 FlyBase annotations (peach).

