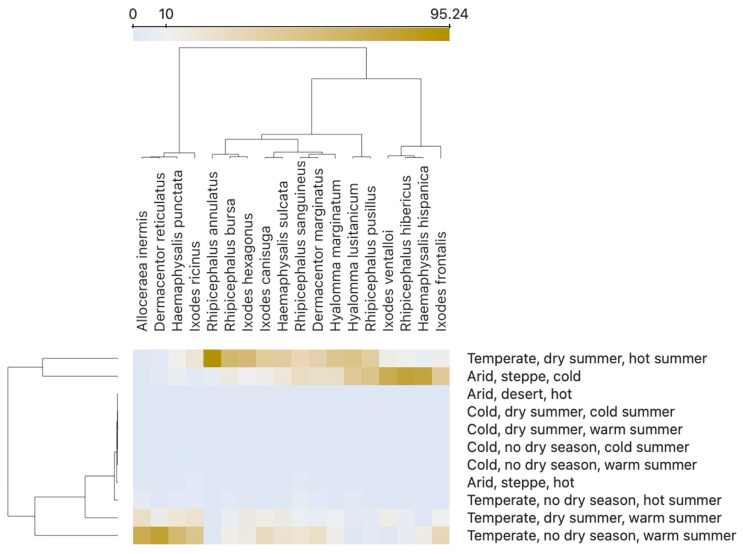
Figure 13.
A heatmap representing the association of 18 species of ticks with climate categories according to the scheme Köppen–Geiger, in peninsular Spain, in the period 1985–2023. The colours in the chart and the colour gradient bar display the percent of times a given tick species was found to be associated with a climate category, using the coordinates for georeferencing. To enhance the contrast, colours are centred at the value of 10% (see the gradient bar, on top of the figure). Clustering was done using the k-means method. It revealed two large groups of ticks (top clustering), the second (right) further divided into two categories. All the categories where ticks were collected are displayed, but several of them (“cold”, “arid-desert”, and “temperature-hot summer”) yielded very few specimens (less than 0.5%).

