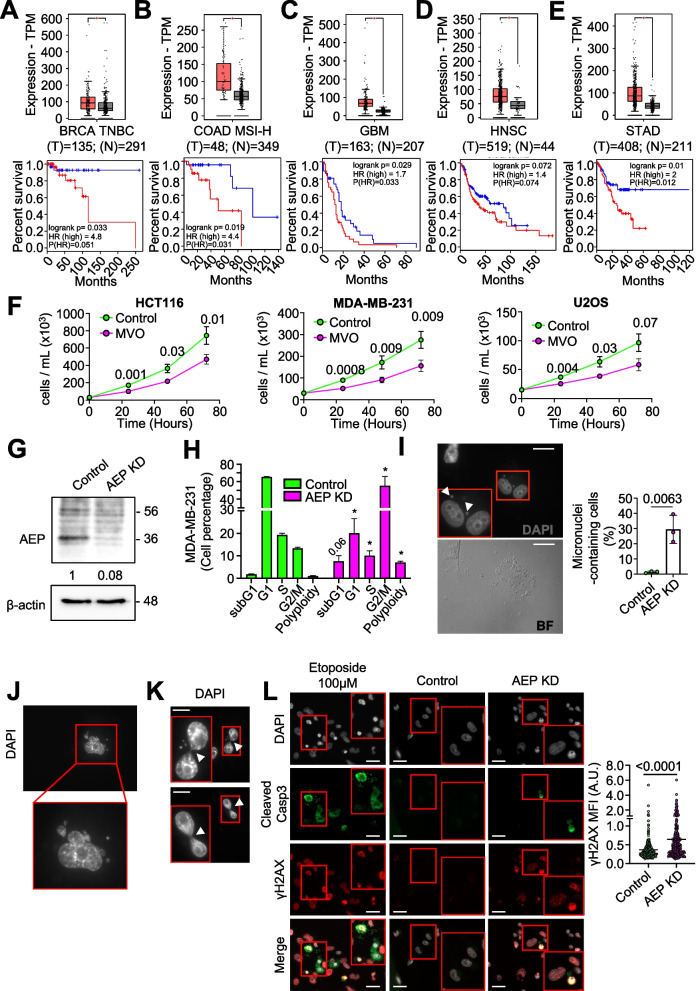
Fig. 1.
AEP deficiency reduces cell proliferation and impact cell cycle in cancer cells. Differential expression levels of AEP in different types of tumors were obtained using the GEPIA2 online application and extracted from The Cancer Genome Atlas (TCGA) database. Kaplan–Meier curves were constructed using the GEPIA2 online application to assess the correlation between AEP expression levels (low AEP blue line; high AEP red line) in different types of human tumors and overall survival. A AEP expression levels in BRCA triple-negative breast cancer (TNBC) patients (n = 135, red) as compared to normal samples (n = 291, grey) [upper panel] and Kaplan–Meier curves showing overall survival of patients with high (red line) or low (blue line) AEP expression levels [lower panel]. B AEP expression levels in colon adenocarcinoma with high genomic instability (COAD MSI-H) patients (n = 48, red) as compared to normal samples (n = 349, grey) [upper panel] and Kaplan–Meier curves showing overall survival of patients with high (red line) or low (blue line) AEP expression levels [lower panel]. C AEP expression levels in glioblastoma (GBM) patients (n = 163, red) as compared to normal samples (n = 207, grey) [upper panel] and Kaplan–Meier curves showing overall survival of patients with high (red line) or low (blue line) AEP expression levels [lower panel]. D AEP expression levels in head and neck squamous cell carcinoma (HNSC) patients (n = 519, red) as compared to normal samples (n = 44, grey) [upper panel] and Kaplan–Meier curves showing overall survival of patients with high (red line) or low (blue line) AEP expression levels [lower panel]. E AEP expression levels in stomach adenocarcinoma (STAD) patients (n = 408, red) as compared to normal samples (n = 211, grey) [upper panel] and Kaplan–Meier curves showing overall survival of patients with high (red line) or low (blue line) AEP expression levels [lower panel]. F Proliferation curves of different cancer cell lines (HCT116 [left panel], MDA-MB-231 [middle panel] and U2OS [right panel]) upon MVO-mediated AEP inhibition. Data represents average of 5 independent, biological replicas ± SD. G Immunoblot showing the shRNA-mediated AEP knock-down in MDA-MB-231 cells. H Cell cycle analyses of control and AEP shRNA-transduced MDA-MB-231 cells. Data represents average of 4 independent, biological replicas ± SD. * p value < 0. 01. I Micrographs showing the presence of micronuclei in MDA-MB-231 cells upon shRNA-mediated AEP KD alongside quantitation. Data represents the average of 3 independent experiments, each one including more than 100 cell ± SD. Size bar = 27 μm. J Micrographs showing examples of polyploid cells in shRNA-mediated AEP KD MDA-MB-231 cells. K Micrographs showing internuclear DNA bridges in shRNA-mediated AEP KD MDA-MB-231 cells. Arrowheads indicate DNA bridges. Size bar = 27 μm. L Micrographs showing γH2AX (red) and cleaved caspase 3 (green) staining in MDA-MB-231 cells treated with 100 μM etoposide for 24 h (left panels), MDA-MB-231 control cells (middle panels) and AEP shRNA-transduced MDA-MB-231 cells (right panels) alongside quantitation representing γH2AX mean fluorescence intensity (MFI) in cells negative for cleaved caspase 3. (n > 300 cells). Size bar = 27 μm

