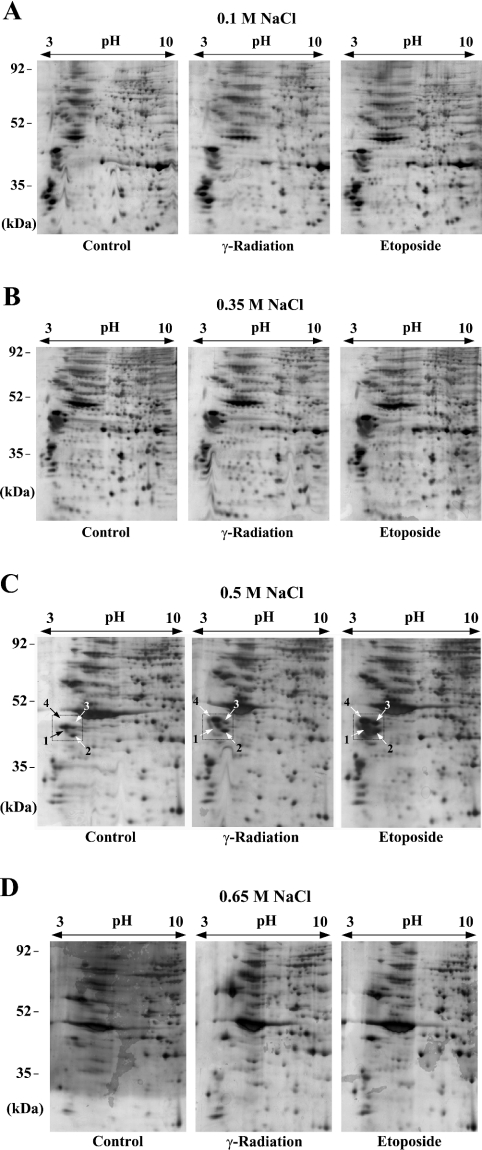
Figure 2. 2-D gel electrophoresis for protein extracts from DNA-damage-induced nuclei.
Protein extracts, prepared as described in Figure 1, were subjected to 2-D gel electrophoresis with a pI range from 3 to 10 and 12.5% gels. The scanned images of silver-stained wet gels are shown. The salt concentrations used for protein extraction are indicated above each group of gels. On each of the gels in (C), the protein spots showing a large difference in their intensity between control and DSB-induced samples are numbered within a box. The indicated protein spots of the third gel (Etoposide) in (C) were excised for trypsin digestion and MALDI–TOF MS analysis.

