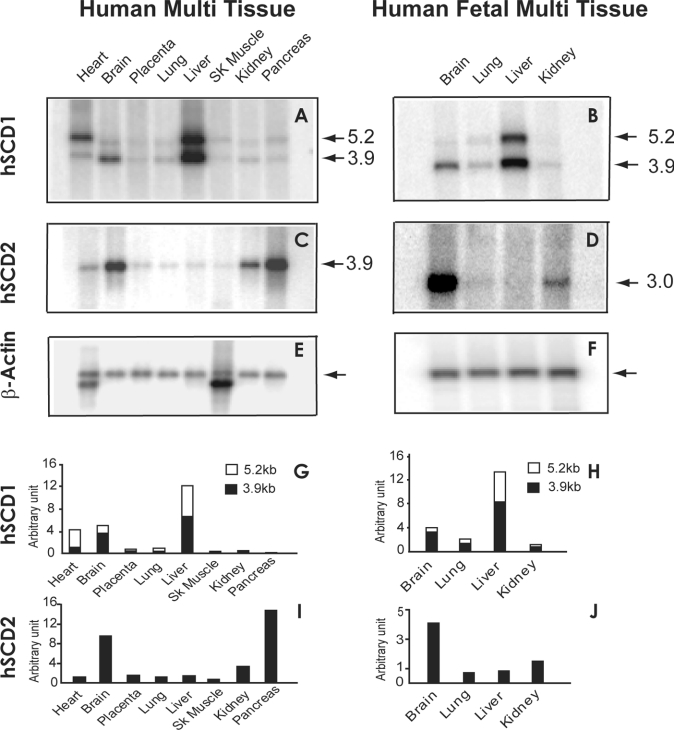
Figure 2. Comparison of tissue distribution profiles between human SCD2 and SCD1 in adult as well as foetal tissues by Northern blot analyses.
Human adult and foetal multiple tissue blots containing 2 μg of polyadenylated RNAs were hybridized with radiolabelled probes prepared from cDNAs of the human SCD1 (A and B) and SCD2 genes (C and D) respectively. Sizes (in kb) are indicated by arrows. The hybridized blots were stripped of residual radioactivity, and re-probed with a radiolabelled β-actin cDNA probe as an internal control (E and F). The arrows indicate the β-actin mRNA band. The expression level of each gene was quantified by normalization with that of β-actin, and is expressed as arbitrary unit (G–J). (G) and (H) represent quantitative data from blots (A) and (B), whereas (I) and (J) represent quantitative data from blots (C) and (D) respectively. SK Muscle, skeletal muscle.

