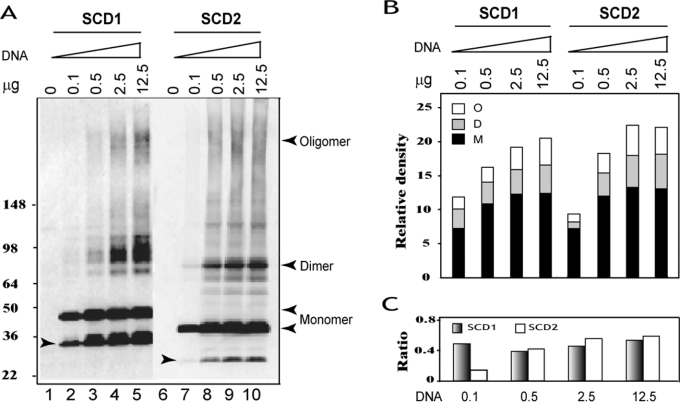
Figure 4. Analysis of subunit composition of SCD enzymes and the effects of expression level on SCD complex formation.
COS-7 cells were transiently transfected with increasing amounts of each FLAG-tagged SCD expression vector (0, 0.1, 0.5, 2.5 or 12.5 μg) or empty vector, and were analysed by Western blot using anti-FLAG antibodies. (A) Detection of different SCD moieties by Western blot analyses. The position of different moieties of each enzyme is indicated by left-hand arrowheads, and degraded products by right-hand arrowheads. (B) Quantification of different moieties of hSCD1 and hSCD2, including oligomers (O), dimers (D) and monomers (M) from (A). (C) The ratio of SCD homodimers and oligomers to monomers of each SCD enzyme from data shown in (B).

