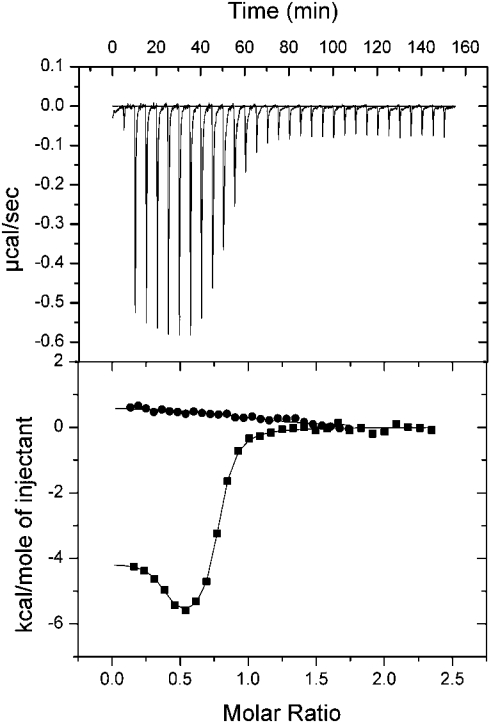
Figure 2. Characterization of the interaction between Scd2 and Cdc42.GTP or Cdc42.GDP by ITC.
Full-length Scd2 was titrated into Cdc42 in 25 mM Hepes, pH 7.5, 50 mM NaCl, 2 mM MgCl2 and 2 mM DTT at 18 °C. The upper plot shows the raw calorimetric data for the Cdc42.GTP–Scd2 interaction. The lower plot shows the isotherm of binding after subtraction of the heat of dilution. The data for Cdc42.GTP binding to Scd2 have been fitted to a two-site binding model. Scd2 titration into Cdc42.GTP (■); Scd2 titrated into Cdc42.GDP (●).

