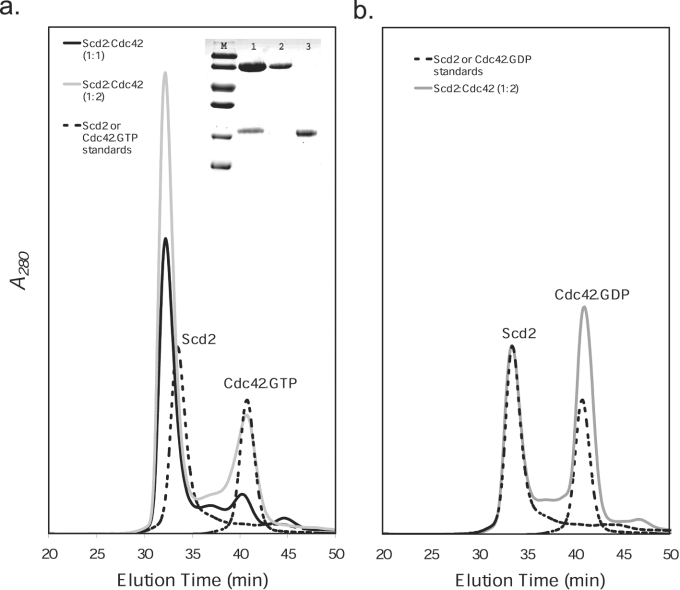
Figure 3. Analytical gel-filtration analysis of complex formation between Scd2 and Cdc42.
Mixtures of Cdc42 and Scd2 were run on Superdex 200 in a buffer of 50 mM Tris/HCl, pH 7.9, 100 mM NaCl and 2 mM MgCl2 at a flow rate of 0.4 ml/min. (a) Analysis of mixtures of Cdc42.GTP and Scd2 at 20 μM. Scd2–Cdc42.GTP (1:1) (solid black line), Scd2–Cdc42.GTP (1:2) (solid grey line), Scd2 and Cdc42 run individually (broken line). The Cdc42 used in the present study was 75–90% GTP-bound as determined by reverse-phase HPLC. Inset, SDS/PAGE (15% gel) analysis of protein fractions. Lane M, molecular-mass markers (97.0, 66.0, 45.0, 30.0, 20.1 and 14.4 kDa); lane 1, fraction at 31.5 min, containing Scd2 and Cdc42; lane 2, Scd2; lane 3, Cdc42. (b) Analysis of mixtures of Cdc42.GDP and Scd2 at 20 μM. Scd2–Cdc42.GDP (1:2) (solid grey line), Scd2 and Cdc42 run individually (broken line).

