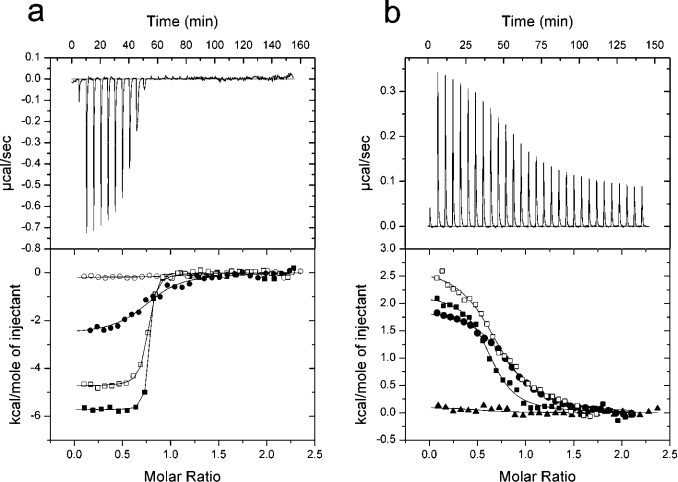
Figure 4. ITC describing the two Cdc42-binding regions in Scd2.
Each Scd2 construct was titrated into Cdc42 in 25 mM Hepes, pH 7.5, 50 mM NaCl, 2 mM MgCl2 and 2 mM DTT at 18 °C. The upper plot shows the raw calorimetric data. The lower plot represents the binding isotherm after subtraction of the heat of dilution. Data for each binding event is fitted to a one-site binding model. (a) Titration of Scd2-(1–86) into Cdc42.GTP (●), titration of Scd2-(1–86)Trp62→Arg into Cdc42.GTP (○), titration of Scd2-(1–123) into Cdc42.GTP (■), and Scd2-(1–123)Trp62→Arg into Cdc42.GTP (□). (b) Titration of Scd2-(188–266) into Cdc42.GTP (▲), titration of Scd2-(110–220) into Cdc42.GTP (■), titration of Scd2-(110–220)Trp160→Arg into Cdc42.GTP (□) and Scd2-(110–266) into Cdc42.GTP (●).

