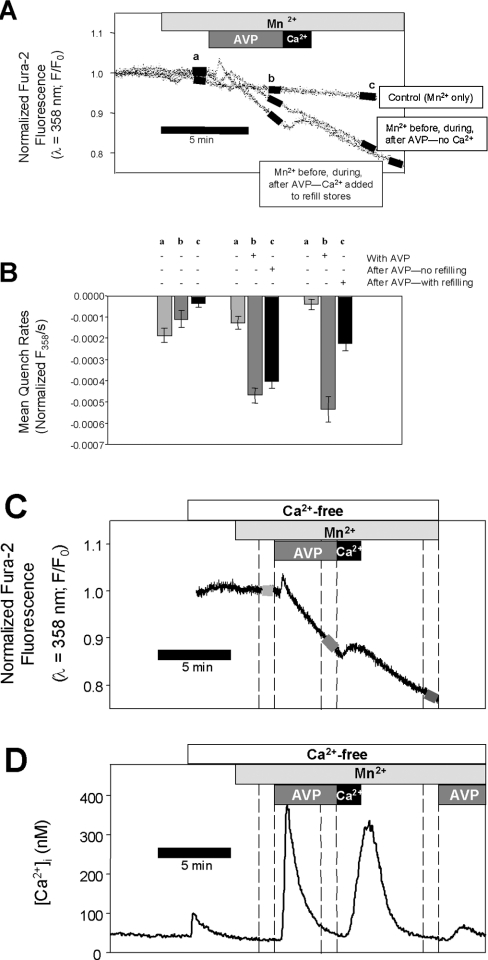
Figure 3. AVP stimulates Mn2+ entry: no rebound after AVP removal.
(A) Unidirectional Mn2+ entry was measured at three time points (labelled a, b and c) in fura 2-loaded A7r5 cell monolayers based on the rate of quench of fura 2 fluorescence (λex=358 nm). Three sets of experiments were performed, represented by the three labelled traces in the top panel: the time course of Mn2+ entry in Ca2+-free medium without any treatment (Control); the time course of Mn2+ entry before, during and after treatment with 100 nM AVP; the time course of Mn2+ entry before and during 100 nM AVP and after a brief introduction of 10 mM CaCl2 to allow partial refilling of the intracellular Ca2+ stores. (B) The rates of fluorescence quench were measured (linear regression) at each of the three time points (black bars superimposed on traces on A) for each set of experiments (n=3–4) and are summarized in the bar graph. The results indicate that capacitative Mn2+ entry is enhanced while AVP is present and is not further increased after AVP removal. (D) Changes in [Ca2+]i that occur during the treatments for the third set of Mn2+ quench experiments (AVP followed by Ca2+). [Ca2+]i was estimated from the 340:380 fura 2 fluorescence ratios recorded from a different coverslip treated with the same solutions. In this case, the cells were exposed a second time to AVP to demonstrate that transient exposure to extracellular Ca2+ enabled the subsequent additional release of intracellular Ca2+. The representative Mn2+-entry recording is aligned temporally on (C) above the [Ca2+]i recording, demonstrating that the rates of quench were determined at those time points when cytosolic [Ca2+] was low and would not interfere with the Mn2+-entry measurements.

